

The Swedish Parliament (Riksdagen) continuously releases open data on its website, which includes documents approved and used during parliamentary sessions as well as what each member of parliament votes during each roll call (voting session).
This data can be used to gain insight on what topics members of parliament and parties discuss and vote. In the following post, I will provide some example analyses that were performed with Python, but it could be done similarly with many other programming languages with data manipulation libraries.
Topic Extraction
For instance, topics can be extracted from the documents using topic mining methods such as ICA (Independent Component Analysis) or Non-Negative matrix Factorization (NNMF). These methods rely on the so-called bag-of-words model that views each document in a corpus as a mixture of words, counting how often a word occurs in the document but ignoring the order of the words. It boils down to defining a document as "this much of this word, that much of that word, etc." Topics are also modeled as mixtures of words too, but these are not defined by any existing document in the corpus, and they are much fewer in number than the documents in the corpus (imagine tens of thousands of documents in the corpus and 10 or 20 topics). ICA and NNMF use statistical computational methods to find a reduced set of topics (i.e. mixtures of words) that can be used to reconstruct relatively accurately the larger number of documents in the corpus.
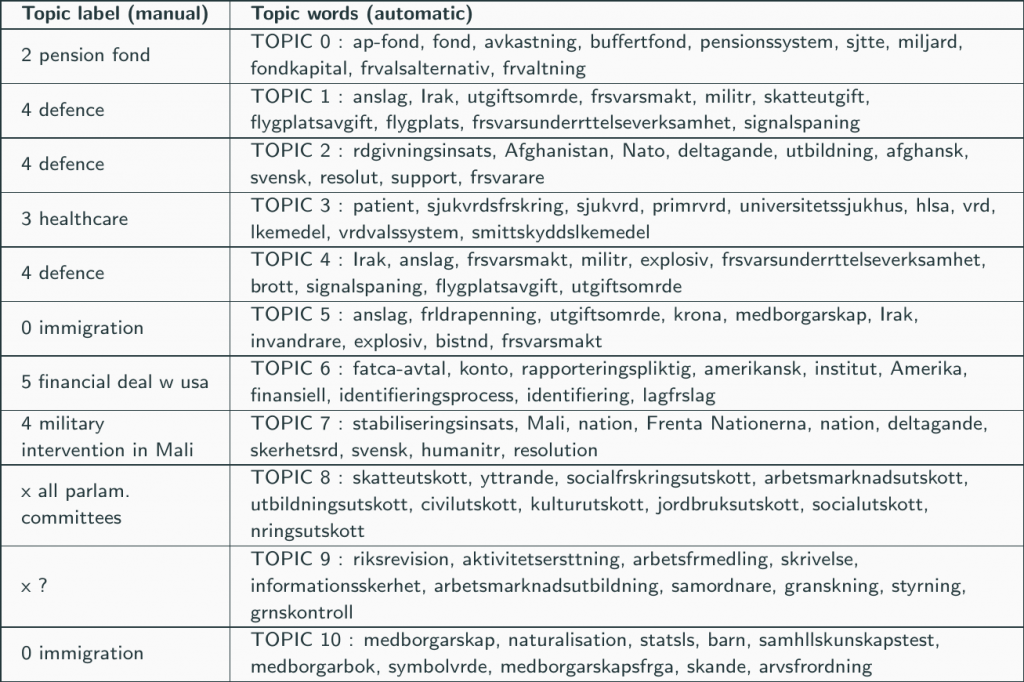
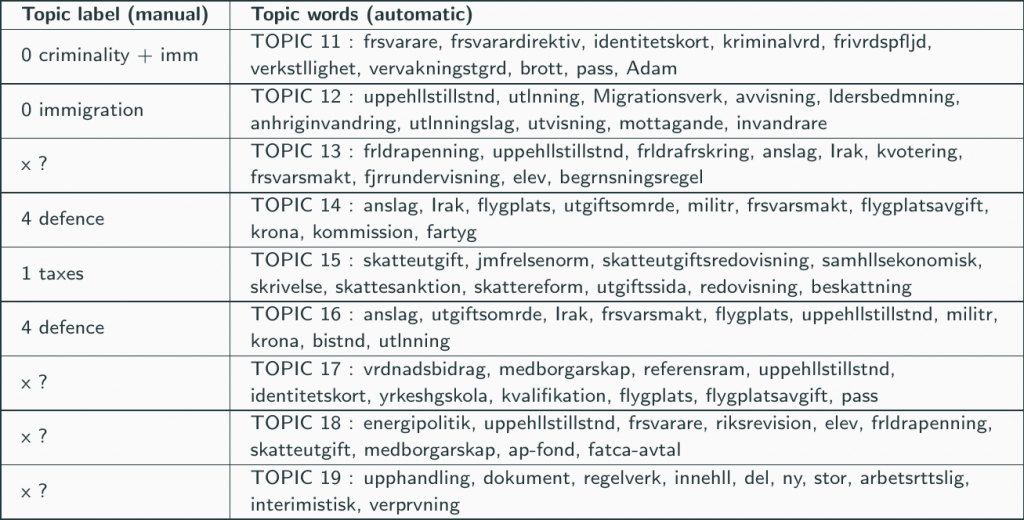
The table below shows the example of using ICA to look for 20 topics on all the documents between 2010 and 2018. The words with a highest weight in the mixture of each topic are shown in the right column. The numbers in the left column are created manually to classify the resulting topics.
Principal Component Analysis
Principal Component Analysis (PCA) is a method that bears some similarities with ICA, and it is indeed used as a sub-step within ICA. In this case, we use it to analyze roll-call data (what each member of parliament votes in each session).
Similarly to how a document was represented as a mixture of words weighted by frequency, in this case, each member of parliament is represented as a mixture of roll calls weighted by the value of his or her vote. If we wanted to visualize each MP as a point in a space, it would require as many dimensions as roll calls, which is a very high number: for the period between 2010 and 2018, there are around 600 voting sessions. PCA allows finding a projection of the data over a reduced set of dimensions that concentrate most of the information. The figure below shows this for two dimensions.
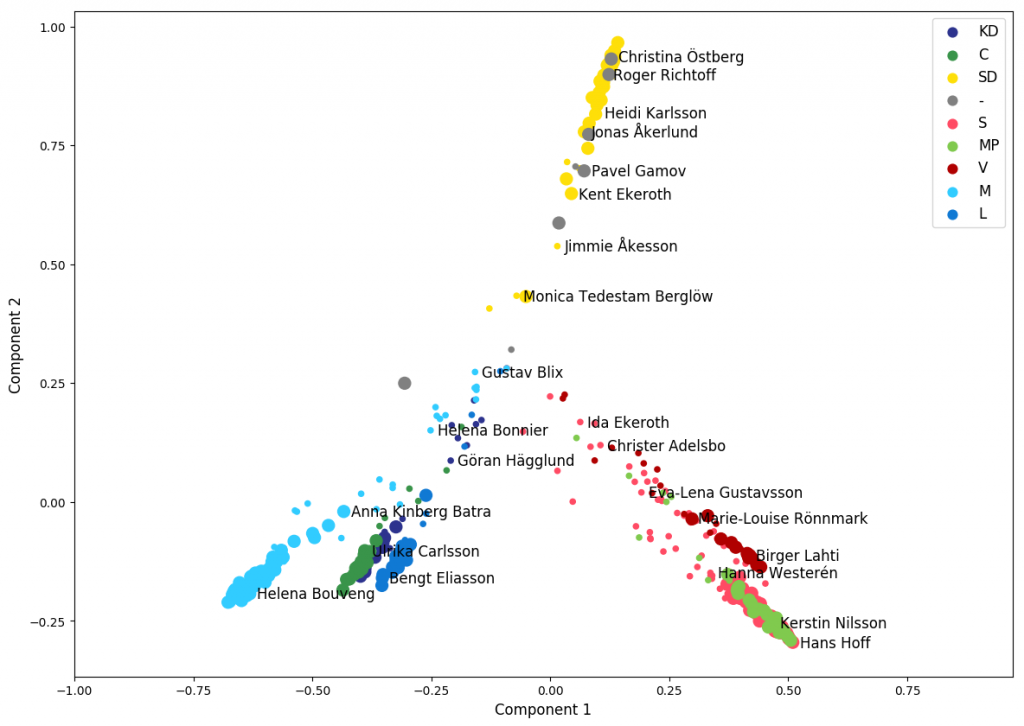
The size of the dots is proportional to the number of yes/no votes, which means that for smaller dots, the member of parliament was absent or unregistered a higher proportion of times during the period at hand. The center of the graph would represents the theoretical option of not voting anything at any time. This means that differences are more to be interpreted as angles than as distances. It becomes quite visible that most members of parliament vote the same as their party colleagues, and the three multi-party blocks (Alliance, Red-Green and SD) are clearly visible.
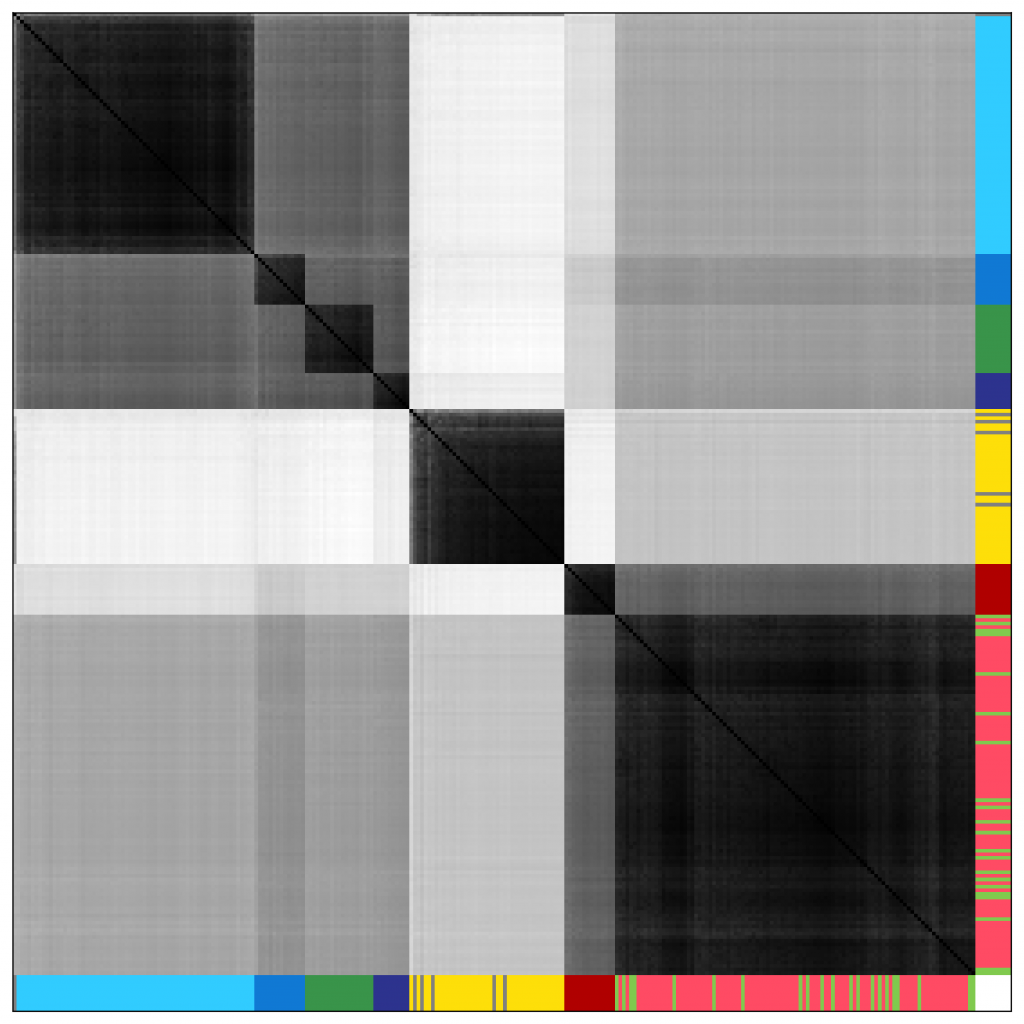
There are other ways to represent the data: each point in the following matrix represents the distance (in terms of how different is their voting record) between each pair of members of parliament. They are too many for their names to be printed but here there is a larger version with names. They are ordered in a line (vertically and horizontally) using hierarchical clustering, which means that that the closer the members of parliament are in the line, the closer their voting records are. As one would expect, most members of parliament get clustered in their own parties, and the three multi-party blocks are visible again.
The roll calls are assigned to parliamentary committees that deal with certain topics. One can divide analyses by committee in order to observe how things vary according to the topic at hand. Since the matrix above is too large, one option is to focus on inter-party relations only, defining each party as the average of all its members. Then it is easier to visualize the results for each committee.
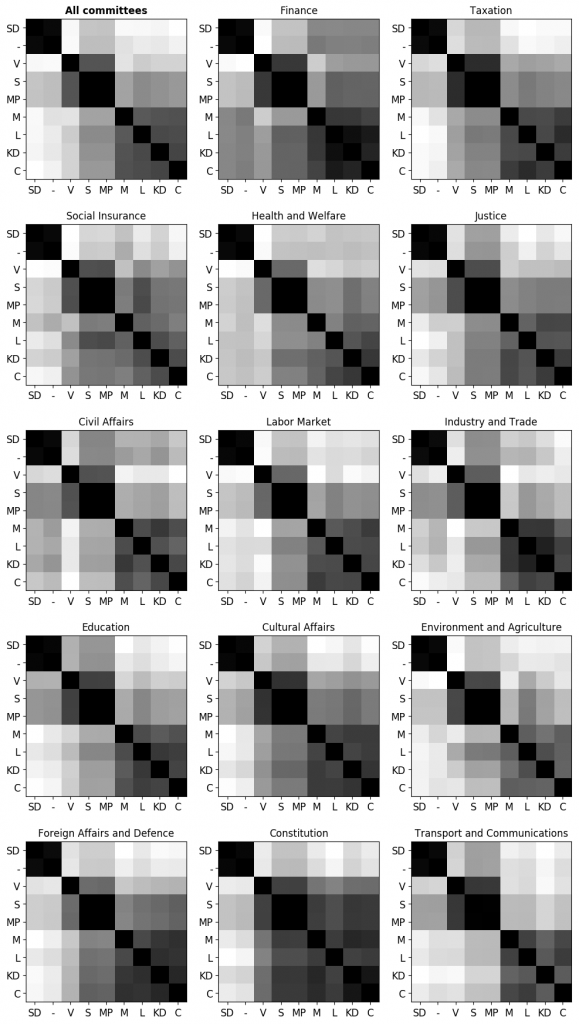
This is just an introduction but many more kinds of analysis are possible combining tools from data science, statistics and language technology, which may allow citizens to have a deeper insight on what their political representatives actually do in the parliament, either during parliamentary debates or legislative activity.