
Appearance
Maps
The Maps section in Strix enables users to visualize geographical data associated with the documents. By plotting geo-locations on a map, users can explore spatial patterns and relationships within the dataset. The map dynamically updates every time the user selects one or more collections, displaying the geo-locations mentioned in the documents from the selected collections.
Key features
Interactive geo-locations
Each geo-location is represented as a point on the map. These points are clickable, allowing users to view detailed information about the number of documents that mention the specific geo-location. If multiple collections are selected, the document counts are separated and displayed in a tabular format for clarity (as shown in the figure below).Users can click the "Show hits" button to open a new tab right beside the Maps tab. This tab lists all the documents where the selected geo-location is mentioned.
Handling large datasets
Collections like Wikipedia, which contain hundreds of thousands of geo-locations, are efficiently visualized using clusters:- Standalone points: If a geo-location has no other nearby locations, it is displayed as an individual point.
- Clusters: When multiple geo-locations are close to each other, they are grouped into a cluster. The cluster displays a number indicating how many geo-locations are in that area.
As users zoom in, clusters break apart into individual points, providing a more granular view. Conversely, as users zoom out, the points merge back into clusters for a cleaner, high-level overview.
Example view
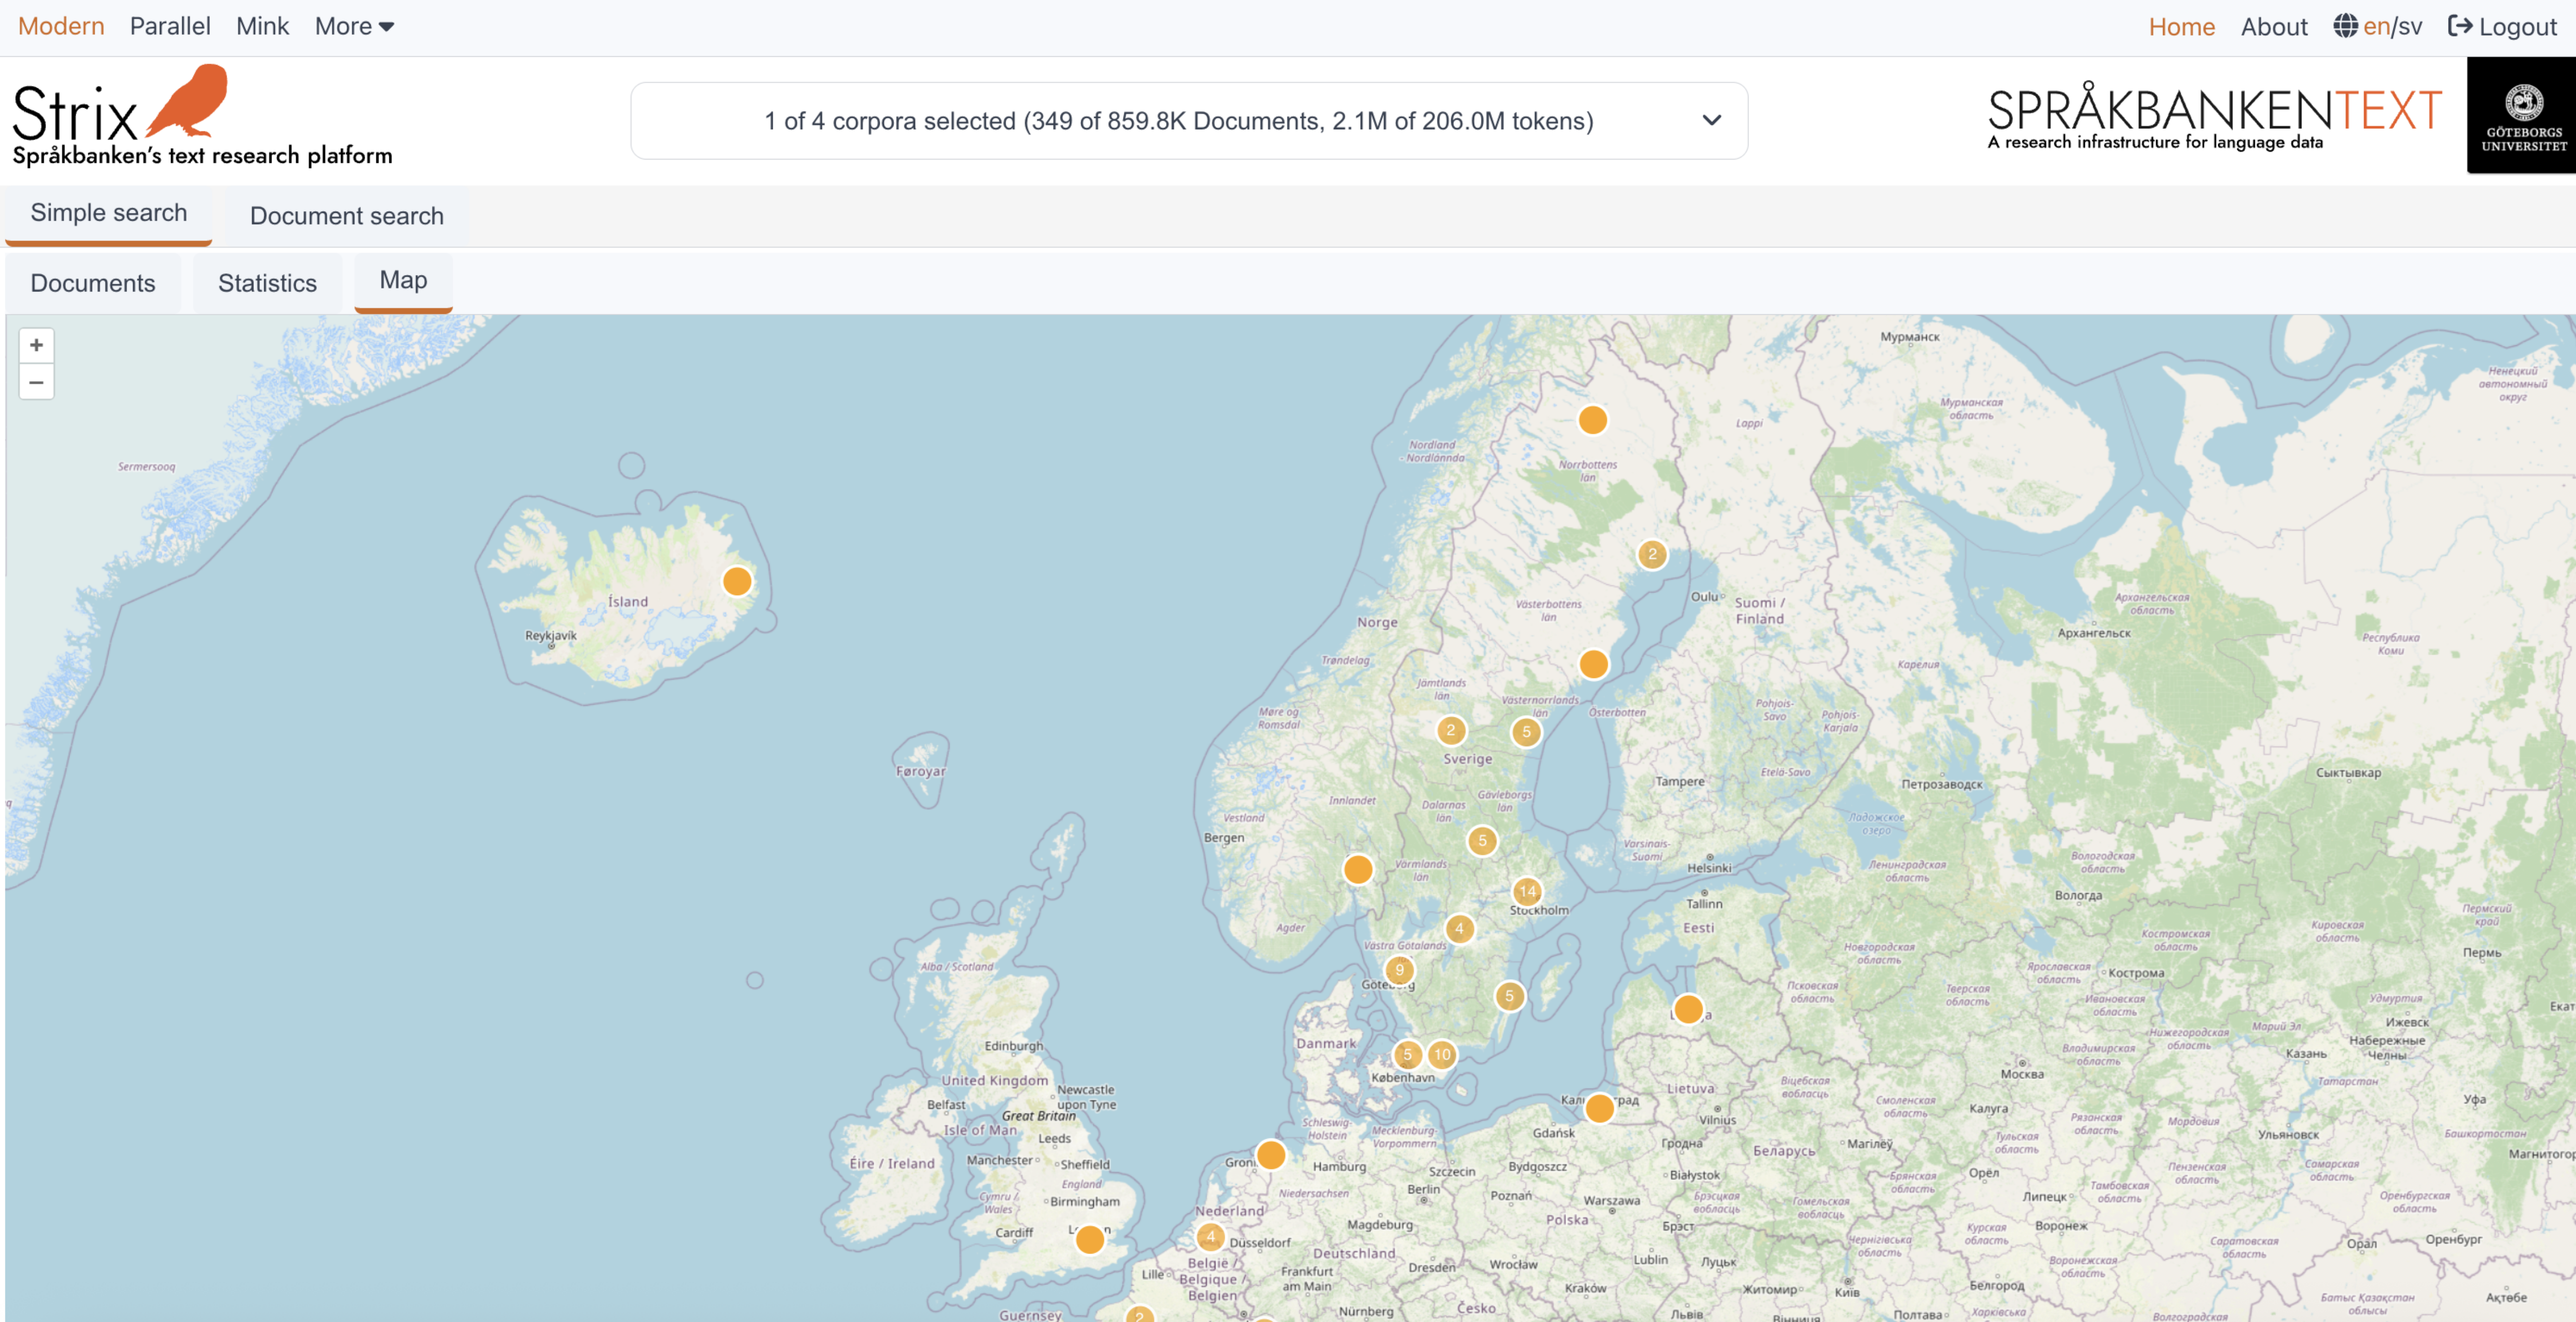
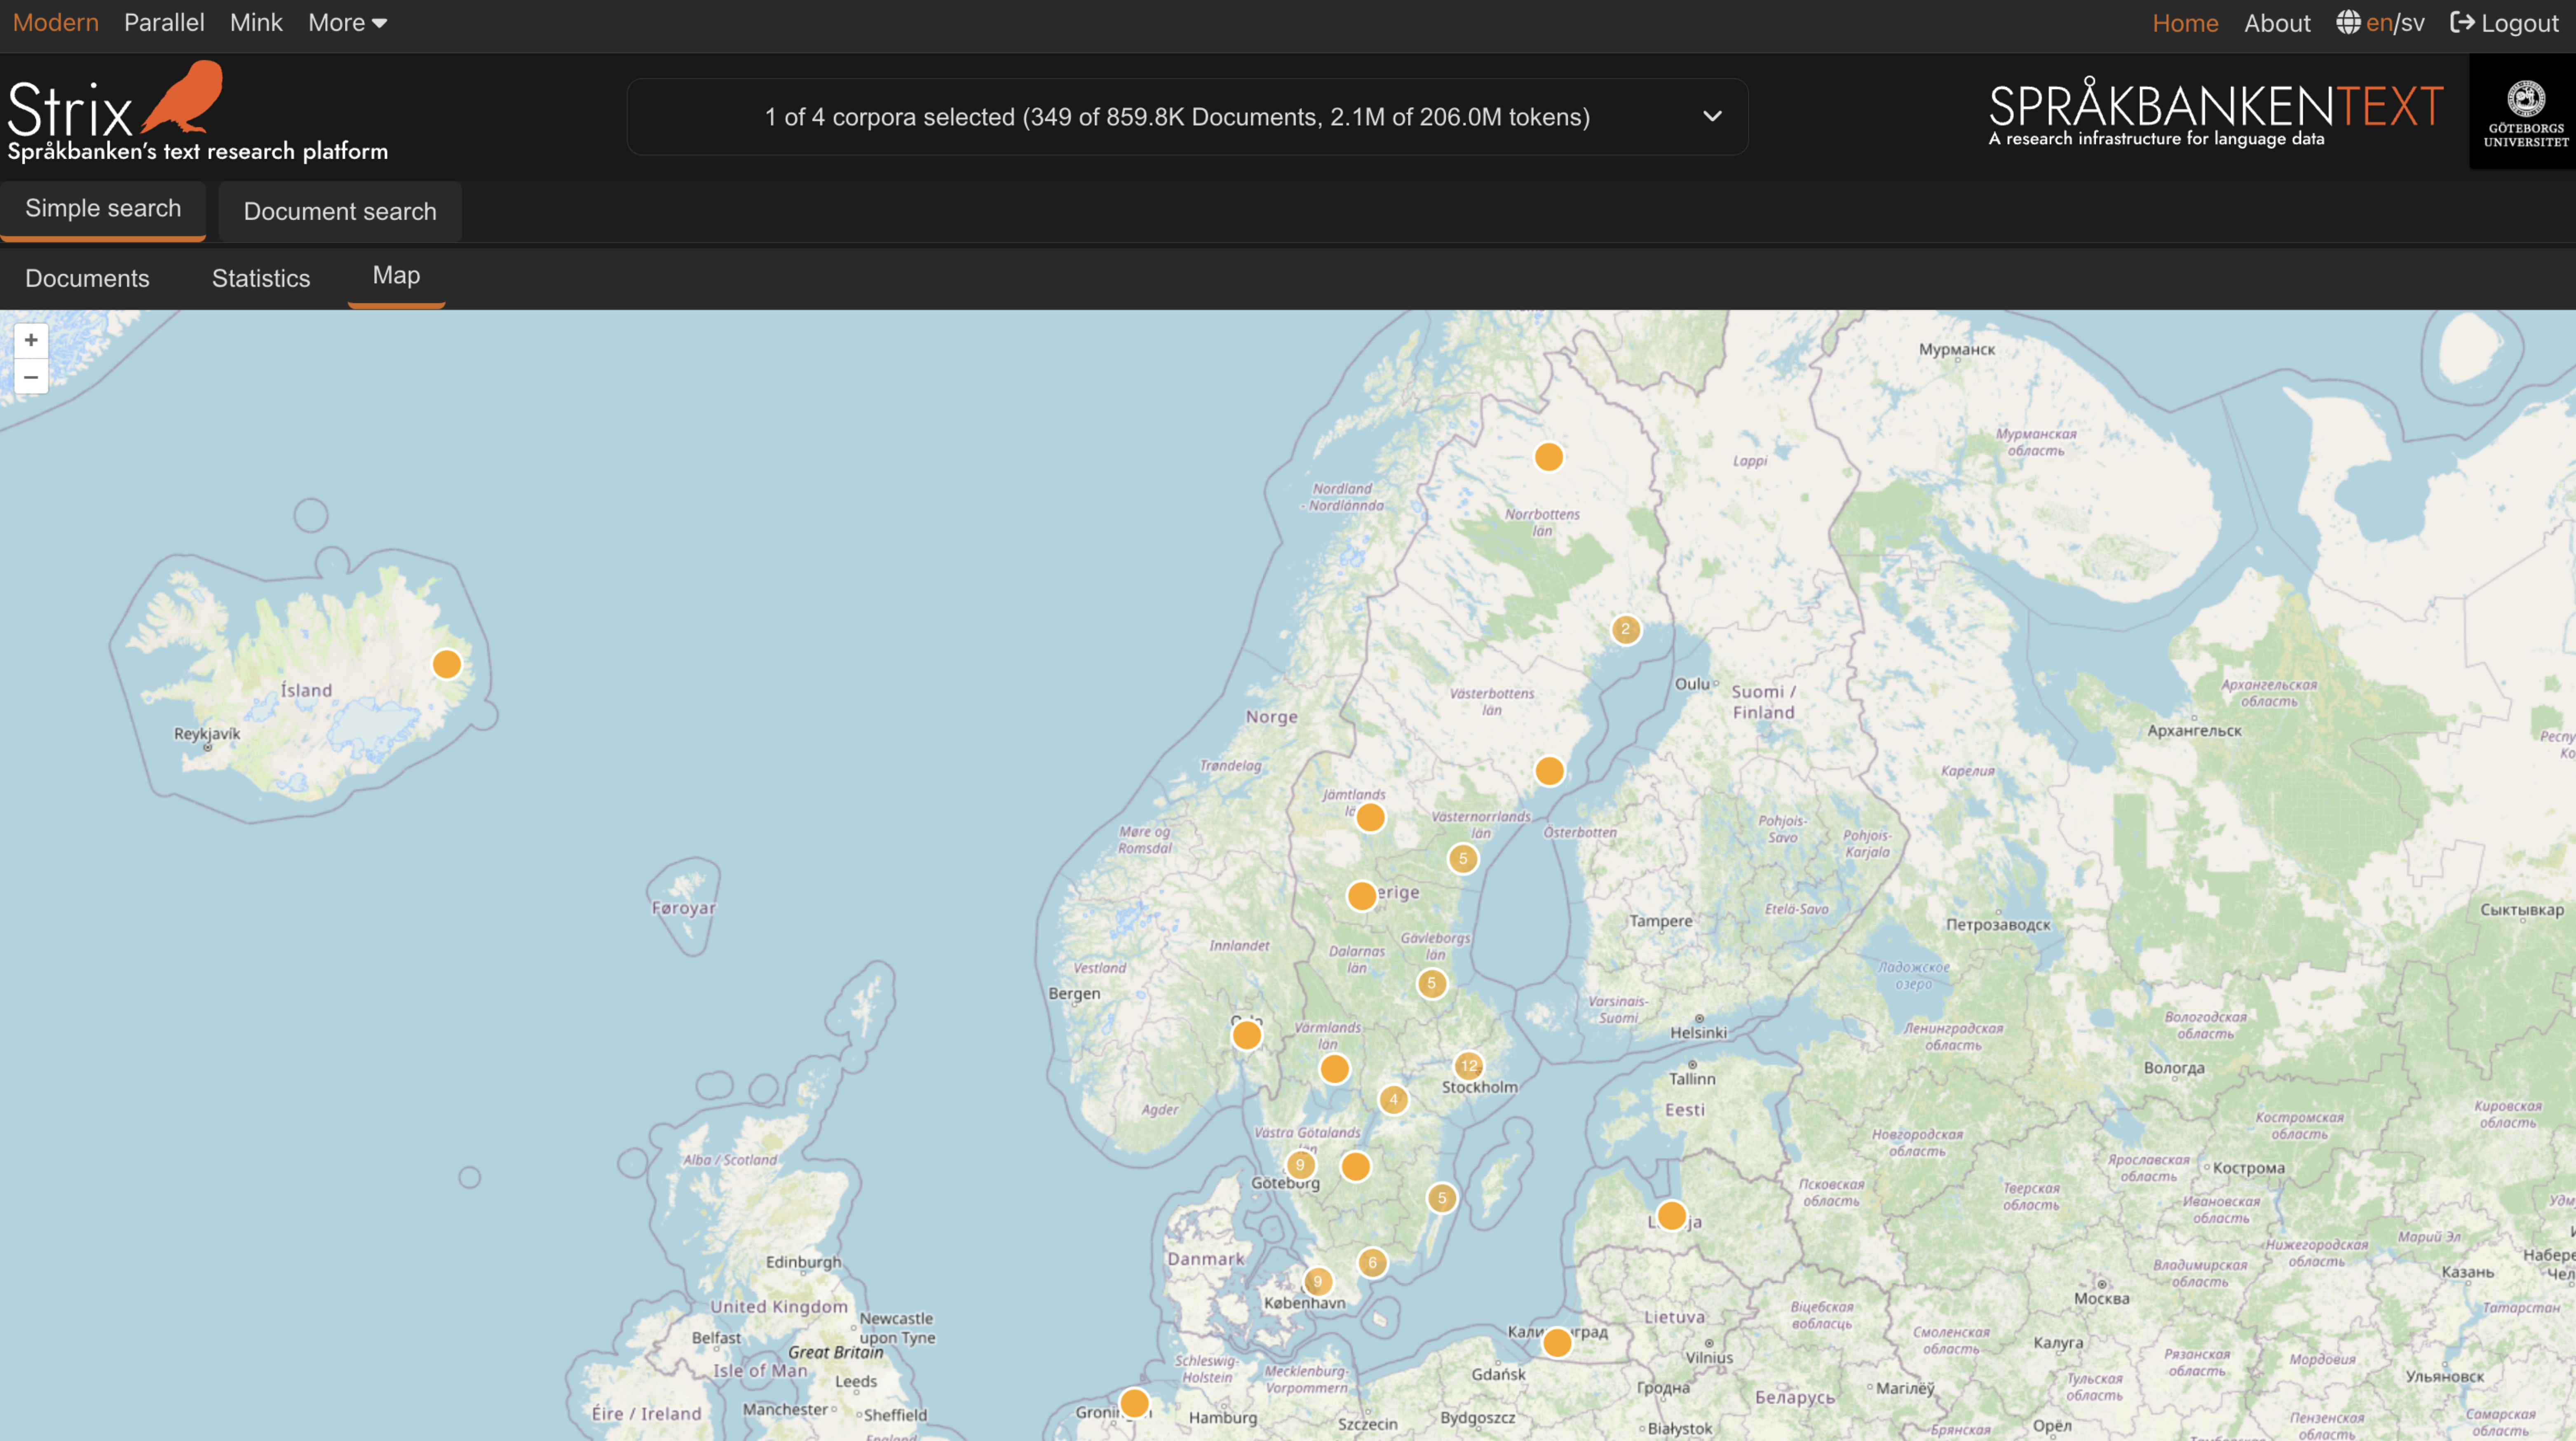
This intuitive and interactive design allows users to explore geographical data effectively, whether they are analyzing a small dataset or navigating through massive collections like Wikipedia. The combination of points, clusters, and detailed document views ensures that users can uncover spatial patterns and relationships with ease.