
Appearance
Statistics
The Statistics section in Strix provides users with the ability to explore metadata attributes and their elements, showing how many documents in a collection belong to a particular element. The statistics view is divided into two parts, as shown in the figure below:
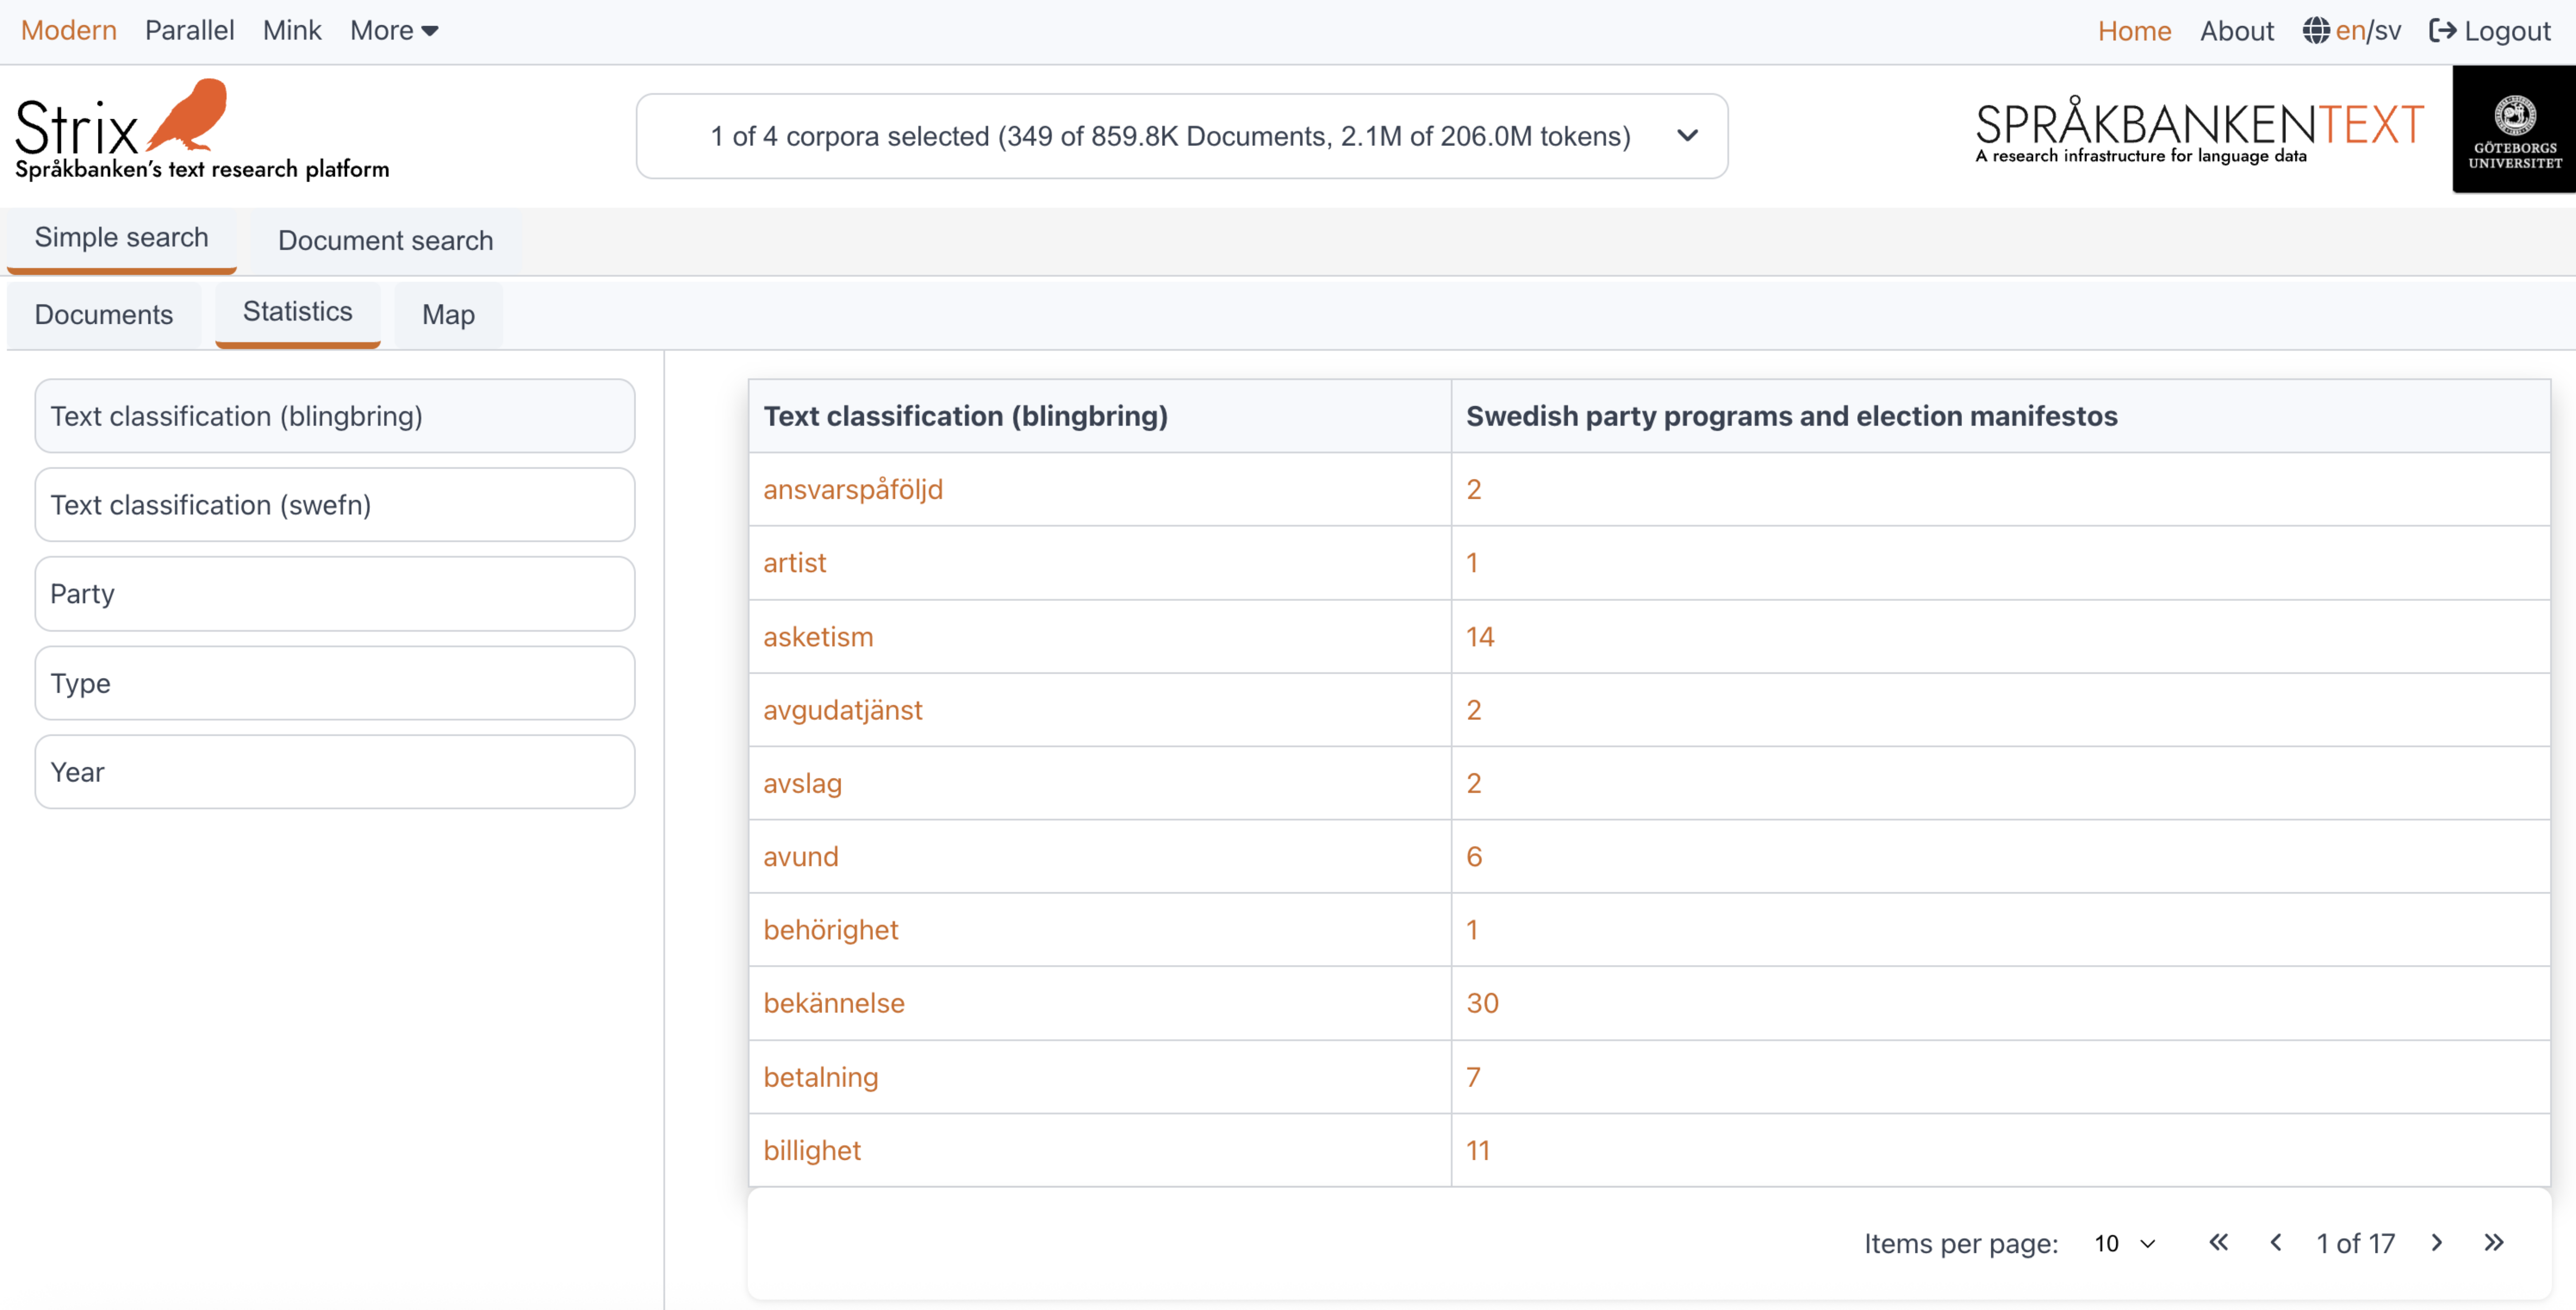
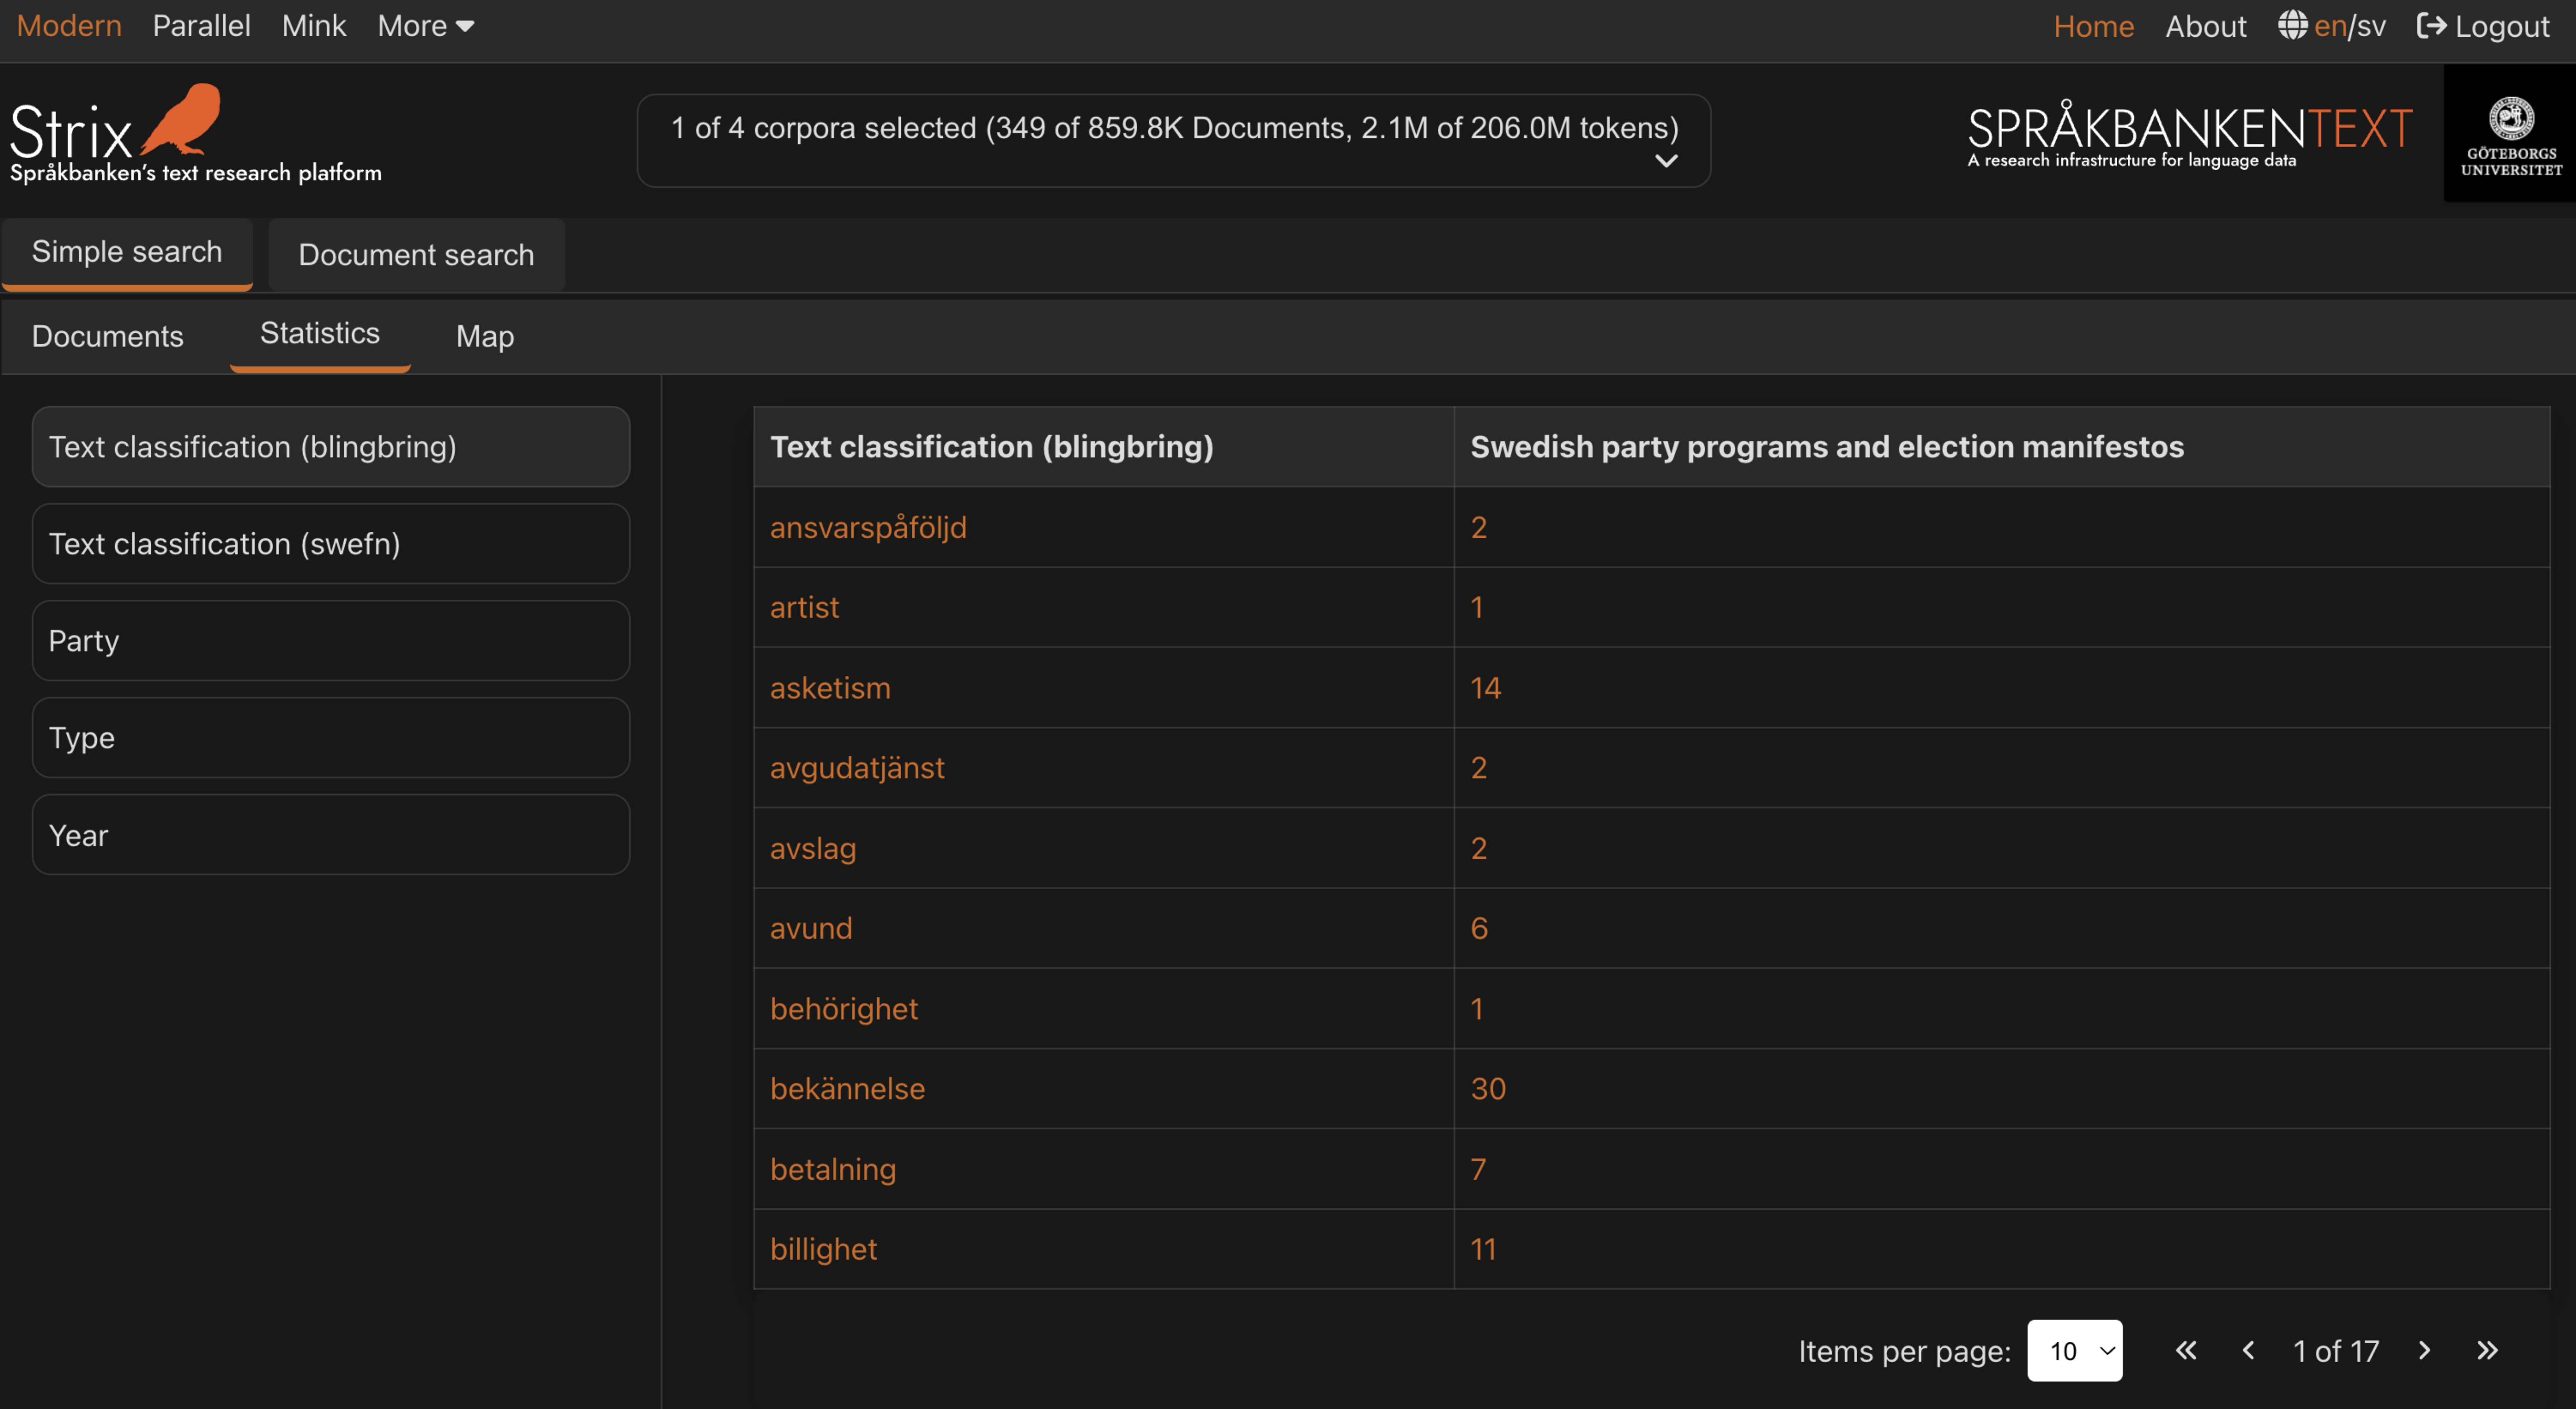
On the left side, users can see the metadata attributes available in the selected collections. On the right side, a tabular view displays the statistics for the selected metadata attribute. Below is a detailed explanation of these two parts and how they work.
Metadata section
The left side of the statistics view contains a list of metadata attributes. This list updates dynamically whenever a collection is selected or deselected. The list represents the union of metadata attributes available across the selected collections.
- By default, the metadata attribute "Text classification (Blingbring)" is selected when the user navigates to the statistics page.
- The table on the right updates automatically whenever a new metadata attribute is selected from this list.
This dynamic behavior ensures that users always see the most relevant metadata attributes for their selected collections.
Table view
The right side of the statistics view displays a table with the statistics for the currently selected metadata attribute. The table is structured as follows:
First column:
This column lists the elements of the currently selected metadata attribute (e.g., elements in "Blingbring" as shown in the figure). These elements update dynamically whenever the user selects or deselects a collection.Second column:
This column represents the first collection that the user selected. It shows the frequency of each element in that collection.Dynamic columns:
Columns beyond the second are added or removed dynamically based on the user's selection or deselection of collections. Each column corresponds to a selected collection and shows the frequency of the elements in that collection.
Interactive features
Each value and frequency in the table is color-coded for interactivity:
Black text:
Indicates that the value is not clickable. This occurs when an element in the selected metadata attribute has a frequency of0.Colored text:
Indicates that the value is clickable. Clicking on these values opens a new tab right after the Maps section, displaying the documents associated with the selected element or frequency.
Click behavior:
Clicking on an element:
Displays all documents across the selected collections that contain the element.Clicking on a frequency:
Displays the documents from the specific collection that contain the element with the selected frequency.
This intuitive design allows users to explore metadata attributes and their elements in detail, making it easier to analyze and navigate large collections of documents.