
Appearance
\newpage \begin{center} \includegraphics[width=0.5\textwidth]
Strix - Språkbanken's Text Analysis Platform
\end
\newpage
Welcome to the user manual for Strix, Språkbanken's cutting-edge platform for advanced text analysis and exploration. Strix empowers researchers, linguists, and organizations to analyze diverse datasets, uncover patterns, and gain insights into textual data. Whether you're working with historical texts, political speeches, or modern corpora, Strix provides the tools you need to explore, visualize, and understand your data.
This guide will walk you through the features and functionalities of Strix, from performing simple searches to visualizing metadata and exploring semantic relationships between documents. With Strix, you can harness the power of language technology to unlock the full potential of your datasets.
Table of Contents
- What is Strix?
- Data Selection
- Search
- Filters
- Data Visualization
- Document View
- Related Documents
- Login Access
Quick start guide
Welcome to the Strix quick start guide! This guide provides step-by-step instructions to help you get started with Strix quickly. Below are the key tasks you can perform:
- Search for documents
- Select corpora
- Switch modes
- Explore related documents
- Statistics and maps
- Adding your own data to Strix
Search for documents
Imagine you're curious about how different political parties in Sweden approach the topic of klimat politik (climate policy). Strix can help you uncover insights by searching through political manifestos, speeches, and other documents. Let’s explore how you can use Strix to dive into this topic.
Simple search: Starting with a word
You decide to start with a simple question: What do political documents say about "klimat"?
- Navigate to the Search bar at the top of the Strix interface.
- Type the word
klimatinto the search bar. - Press the Search button or hit
Enter. - Strix will return a list of documents mentioning the word "klimat," allowing you to explore how it is discussed across different contexts.
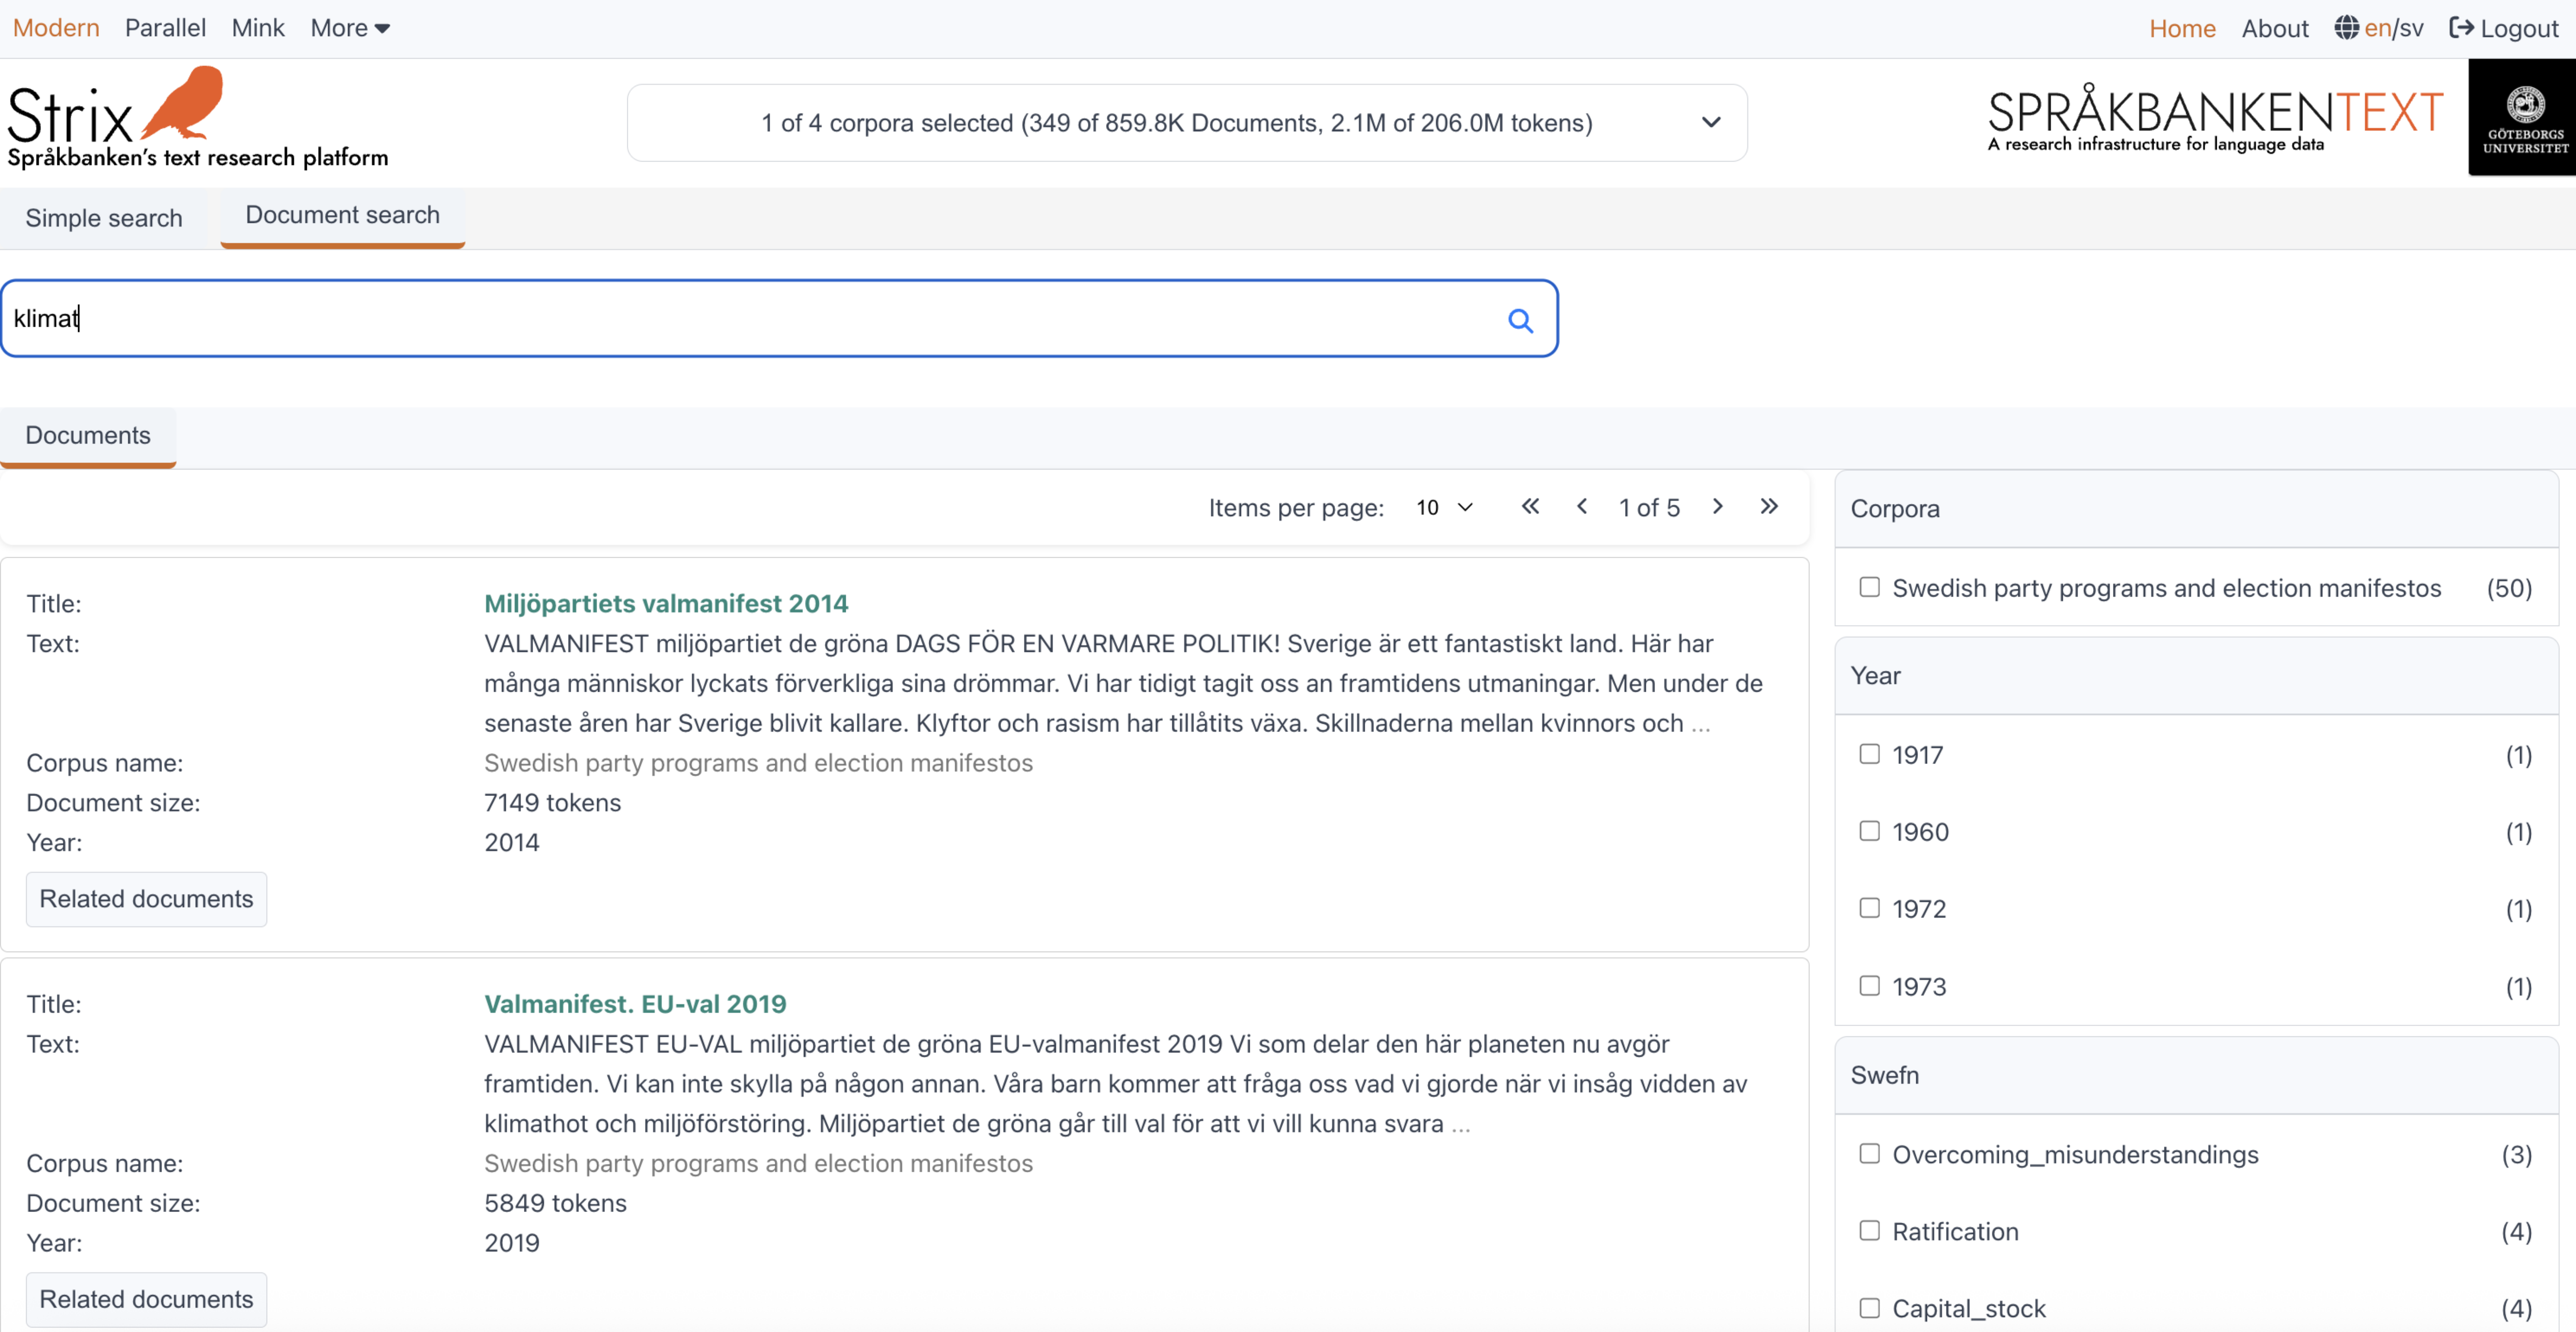
Example:
Search for the word klimat in the Swedish party programs and election manifestos corpus.
Search example: klimat
Document search: Exploring climate policy
Now, you want to dig deeper. You’re interested in understanding how klimat politik is framed by different political parties. Strix’s Document search feature can help you find semantically similar documents that discuss this topic.
- Select the Document search tab (if available).
- Navigate to the Search bar.
- Enter the phrase
klimat politikinto the search bar. - Press the Search button or hit
Enter. - Strix will retrieve the top 50 documents that are semantically similar to your query. These documents may include political manifestos, speeches, or reports that discuss climate policy.
Example:
Search for the phrase klimat politik.
Search example: klimat politik
Related documents – What do the parties think?
You’ve gathered some insights, but now you want to compare how different political parties approach klimat politik. Strix’s Related documents feature can help you connect the dots and uncover deeper relationships between documents.
- Select a document from the search results that seems particularly interesting (e.g., a manifesto from a specific party).
- Click on the Related documents button to explore other documents that are semantically similar.
Example:
Explore documents related to a political manifesto in the Swedish party programs and election manifestos corpus. This will help you see how different parties frame their stance on klimat politik and identify recurring themes or contrasting viewpoints.
For instance, you might find that one party focuses on sustainability, while another emphasizes economic growth. The Related documents feature allows you to compare these perspectives side by side, helping you build a more comprehensive understanding of the discourse.
Conclusions
By following these steps:
- You started with a broad search to understand the general discourse.
- You narrowed your focus to explore specific policies and stances.
- You used related documents and visualizations to compare perspectives across parties.
Strix empowers you to uncover insights and build a comprehensive understanding of how klimat politik is discussed in Swedish politics. Now it’s your turn to explore further and uncover deeper insights hidden in the data.
Select corpora
Corpora are collections of documents in Strix. Follow these steps to select or deselect corpora:
Steps to select corpora
- Navigate to the Data selector on the top-right side of the interface.
- Use the checkboxes to select or deselect corpora.
- The selected corpora will update the documents and filters dynamically.
Example:
Select the Swedish party programs and election manifestos corpus to focus on political documents.
Buttons in the Data selector
- Select all: Selects all corpora in the current mode.
- Deselect all: Deselects all selected corpora.
- Default: Resets the selection to the default corpora for the current mode.
Switch modes
Modes in Strix categorize datasets based on their type. Follow these steps to switch modes:
Steps to switch modes
- Navigate to the Mode selector above the Strix logo on the top-left side of the interface.
- Click on a mode (e.g., Modern, Mink, Parallel) to select it.
- The selected mode will update the available corpora in the Data selector.
Example:
Switch to the Parallel mode to explore datasets with source and reference documents, such as translations or OCR-corrected texts.
Default mode
The default mode in Strix is Modern, which contains datasets written in contemporary Swedish.
Explore related documents
The Related documents feature helps you find documents that are semantically similar to a selected document. Follow these steps to explore related documents:
Steps to explore related documents
- Select a document from the search results or document list.
- Click on the Related documents button (if available).
- View the list of semantically similar documents in the Related documents tab.
Example:
Explore documents related to a political manifesto in the Swedish party programs and election manifestos corpus.
Graph visualization
- Switch to the Graph view to visualize relationships between the selected document and its related documents.
- Interact with the graph by zooming in/out or clicking on nodes to view more details.
Statistics and maps in Strix
Strix provides powerful tools for visualizing and analyzing data through Statistics and Maps. These features help you uncover patterns, trends, and relationships in your datasets.
Statistics: Analyze metadata attributes
The Statistics section allows you to explore metadata attributes and their elements, showing how many documents in a collection belong to a particular category.
How to use statistics
- Navigate to the Statistics tab in the Strix interface.
- On the left side, select a metadata attribute (e.g., "Text Classification (Blingbring)" or "Year").
- On the right side, view the frequency of each element in the selected attribute across your chosen collections.
Example: Analyze year distribution
- Select the Year attribute from the metadata list.
- View the table on the right to see how many documents were published in each year.
- Click on a specific year (e.g.,
1920) to view all documents from that year.
Interactive features:
- Filter the table: Use the search box to narrow down results.
- Click on elements: Click on a metadata element (e.g., a specific year or topic) to view related documents.
Maps: Visualize geo-locations
The Maps section enables you to explore geographical data associated with your documents. Geo-locations mentioned in the documents are plotted on an interactive map.
How to use maps
- Navigate to the Maps tab in the Strix interface.
- Select one or more collections to display geo-locations from those datasets.
- Interact with the map:
- Click on points: View detailed information about the documents mentioning a specific geo-location.
- Zoom in/out: Explore clusters of geo-locations or focus on individual points.
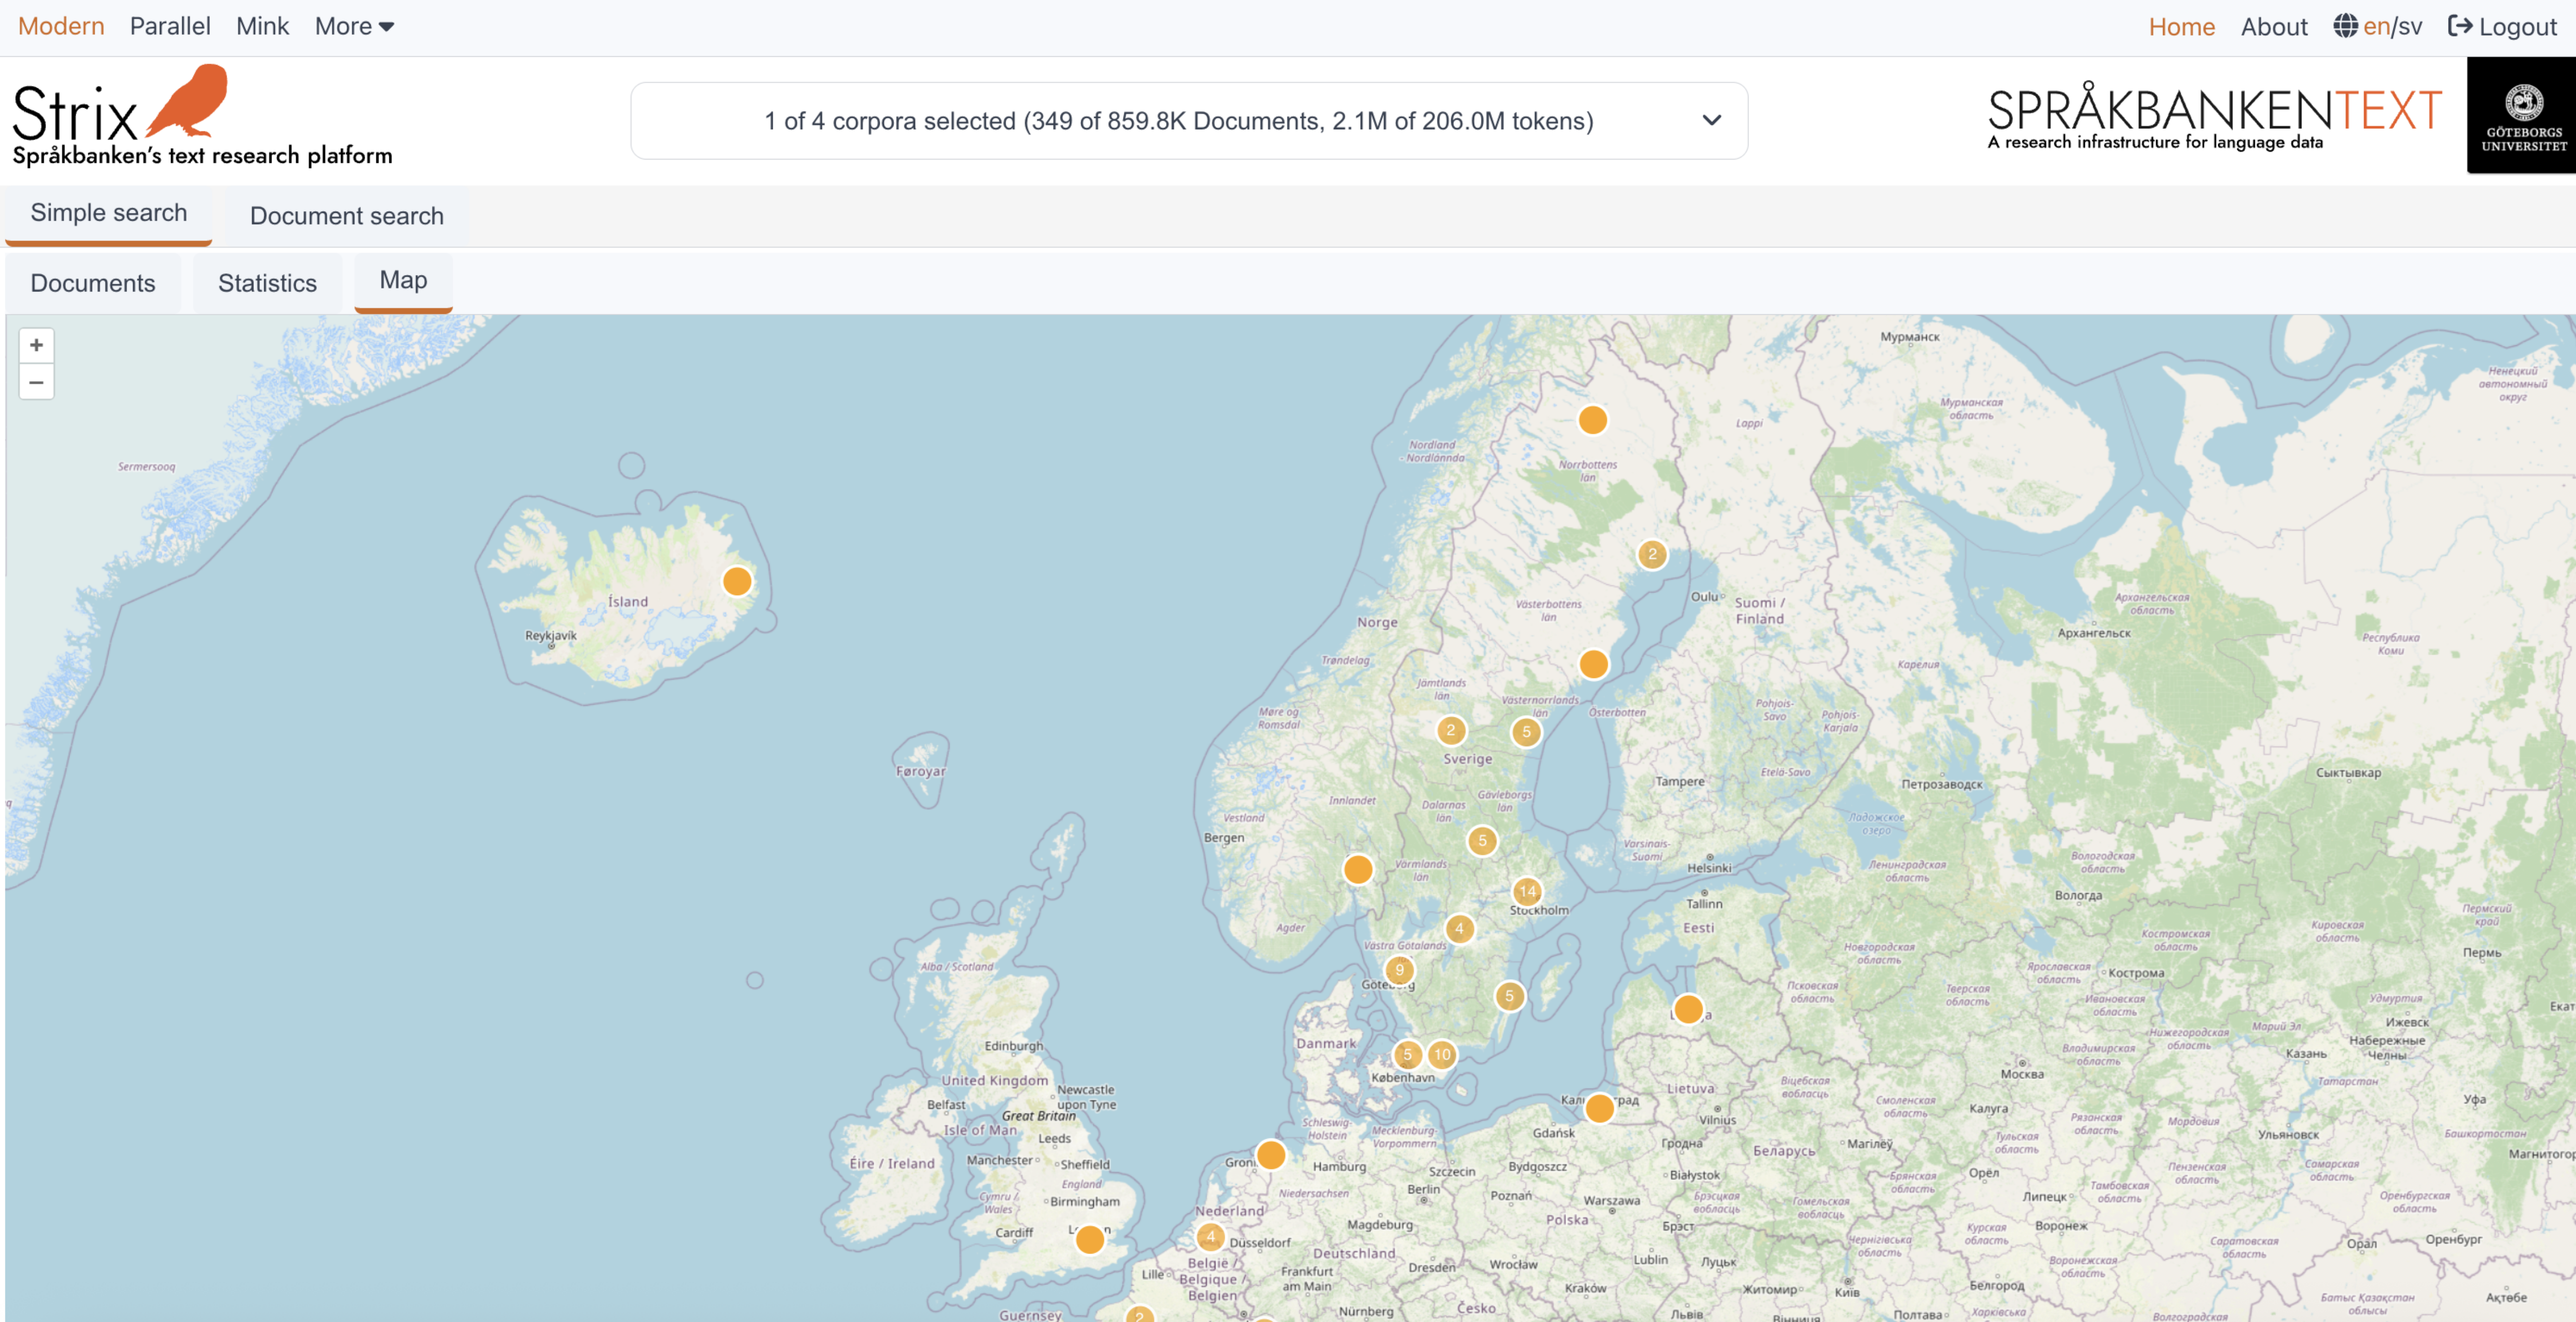
Example: Explore geo-locations in political documents
- Select the Swedish party programs and election manifestos corpus.
- View the map to see locations mentioned in political manifestos.
- Click on a location (e.g., "Stockholm") to see all documents referencing it.
Interactive features:
- Clusters: Large datasets like Wikipedia are grouped into clusters for easier navigation. Zoom in to break clusters into individual points.
- Document links: Click on a geo-location to open a list of related documents.
Why use statistics and maps?
- Statistics: Helps you analyze the distribution of metadata attributes, such as publication years, topics, or sentiment labels.
- Maps: Provides a spatial perspective, enabling you to explore geographical patterns and relationships in your data.
These tools make it easier to uncover insights and gain a deeper understanding of your datasets.
Start exploring Statistics and Maps in Strix to unlock the full potential of your data!
Adding your own text data to Strix
Strix allows users to upload their own text data (a collection of documents) and leverage its advanced functionalities to analyze, visualize, and explore the data. This feature is particularly useful for researchers, linguists, and organizations looking to exploit their custom datasets.
Why add your own data?
By adding your own text data to Strix through Mink, you can:
- Perform advanced searches: Use simple and document searches to explore your custom datasets.
- Visualize metadata: Analyze metadata attributes and geo-locations using Statistics and Maps.
- Explore semantic relationships: Use the Related documents feature to uncover connections between documents.
- Analyze linguistic patterns: Dive into word, sentence, and text-level metadata attributes for deeper insights.
What is Mink?
Mink is Språkbanken's data platform that allows users to upload their collections and apply advanced language technology methods to their texts. The resulting annotated data can be:
- Downloaded for offline use.
- Integrated into research tools like Korp and Strix for further analysis.
You can read more about Mink and its documentation and tutorials at https://spraakbanken.gu.se/en/tools/mink.
All data uploaded to Mink is securely stored behind a login and is not publicly available to other users.
How to add your data to Strix
Below are the steps to upload your data in Mink, annotate it, and make it available in Strix.
1. Prepare your data
Before uploading your data, ensure it meets the following requirements:
- File format: Supported formats include
.txt,.docx,.odt,.pdf, or.xml. - Metadata: Include metadata for each document (e.g., title, author, year, genre) as tags/attributes if the file format is
.xml. - Encoding: Use UTF-8 encoding to ensure compatibility.
- File size: Ensure individual files do not exceed the maximum upload size (e.g., 10 MB per file).
2. Upload your data
- Log in to the Mink platform.
- Create a corpus name for your collection.
- Select your files or drag and drop them into the upload area.
- Edit the configuration if needed. By default, Mink creates a configuration for each corpus, which includes the following annotations added to each document using the Sparv annotation tool:
- Part of speech tags
- Base form (Lemma)
- Morphosyntactic tags (MSD)
- Dependencies
- Sentiment labels
- Run the annotation process.
- Once the annotation is completed, the annotated data will be ready for download and available for installation in Strix and Korp.
3. Index your data and install in Strix
After annotating your data, install the corpus into Strix:
- Install the annotated corpus into Strix from the Mink platform.
- Strix will automatically index your data to make it searchable and compatible with its advanced features.
- Monitor the indexing progress in the Status section in Mink.
- Once the installation is complete, the Status section will display a "Done" message.
4. Access your data in Strix
After indexing, your data will appear under the Mink mode (personal collections) in Strix. You can either:
- Go to Strix and log in to view your data in Mink mode
- Or, follow the link from Mink to Strix by clicking on the Open button located next to the Install button.
Once, you are in Strix, you can:
- Select your dataset to perform searches and visualizations.
- Combine your dataset with other existing corpora for comparative analysis.
Example use case: Analyzing global warming
Imagine you are a researcher studying global warming and its representation in political speeches. You have a collection of speeches and reports that you want to analyze. Here’s how you can use Mink and Strix to explore your data:
Upload your data:
- Prepare your collection of speeches and upload them to Mink.
- Annotate the data using Sparv to add linguistic metadata like part of speech tags and sentiment labels.
Install in Strix:
- Install the annotated corpus into Strix and index it.
Perform searches:
- Use Simple search to find occurrences of terms like
global warming (global uppvärmning)orclimate change (klimatförändring). - Use Document search to explore semantically similar documents discussing renewable energy or sustainability.
- Use Simple search to find occurrences of terms like
Visualize metadata:
- Use the Statistics tab to analyze the frequency of terms like "carbon emissions" or "renewable energy."
- Use the Maps tab to visualize geo-locations mentioned in the speeches, such as references to international climate agreements.
Explore related documents:
- Use the Related documents feature to find connections between speeches from different political parties or organizations.
By following these steps, you can uncover patterns, trends, and insights into how global warming is discussed in your dataset.
Troubleshooting and support
If you encounter any issues while uploading or indexing your data:
- Ensure that your files meet the format and size requirements.
- Check the Status section in Mink for error messages or warnings.
- Contact the Strix support team at sb-info@svenska.gu.se for assistance.
Start uploading your data today and unlock the full potential of Strix for your research!
What is Strix?
Strix is Språkbanken's text analysis platform, designed for advanced research and exploration of textual data. It is similar to Korp, Språkbanken's word research platform for searching large amounts of text. However, Strix focuses on full text and a broader range of text analysis capabilities.
The data in Strix is highly diverse, including sources such as newspapers, novels, governmental data, Wikipedia, historical texts, and much more. Each dataset is referred to as a corpus, and each corpus contains a collection of text documents. These documents have been annotated by Språkbanken's analysis platform, Sparv, at the word, sentence, and text levels.
Key Features of Strix
- Document View: View the content of each document and its annotations generated by Sparv (from word to text level) in Codemirror editor view.
- Document Statistics: Analyze token-level statistics for various word attributes within a document.
- Search Capabilities:
- Search within individual documents.
- Perform simple searches or document searches across a selected collection of corpora.
- Data Visualization: View statistics and graphs for selected corpora and documents, and explore text attributes connected to selected documents.
- Maps Section: Visualize locations mentioned in documents on an interactive map.
- Related Documents: Explore similar documents using document vector search powered by KBLab's KB-SBERT sentence transformers.
- Filters: Narrow down your search results using advanced filters.
- Sparv Integration: Visualize and search in those analyzes produced by Sparv.
- And More: Strix offers many additional features to enhance your text analysis experience.
To make navigation easier, the Strix documentation includes images alongside text, helping users understand the platform's features and functionality.
Overview of Strix documentation
Here’s what you can find in this documentation:
- Data selection: Learn more about the data in Strix, including modes, corpora, and corpus details.
- Search: Understand the two search formats in Strix: simple search and document search.
- Filters: Learn how to narrow down your search results using filters.
- Data visualization: Explore how to view documents in the document reader editor and visualize data.
- Document view: Dive into document details and statistics.
- Related documents: Discover similar documents to the one in focus.
- Login access: How to gain access to Strix
Recently added corpora
Data Selection
Strix contains a diverse collection of corpora (datasets or documents) ranging from historical to modern data. Some datasets in Strix are open access and can be viewed without restrictions, while others require login access. Each corpus provides a unique perspective, allowing users to explore and analyze textual data in detail.
Each corpus in Strix belongs to one or more modes. Modes are created based on the type of collection. For example:
Data from 1900 to the present is categorized under the Modern mode.
The Mink mode is available for users who are logged in and have personal collections in Strix. This mode allows users to access and analyze their private datasets securely.
The Parallel mode is designed for datasets where each document has a corresponding reference document. This mode is useful for tasks like translation alignment, OCR correction, or comparing student essays with teacher corrections.
Other modes are created based on specific collections.
More details about modes can be found in the Modes section.
Each mode contains a list of corpora that can be selected or deselected, as explained in the Corpora section. Additionally, the Corpus Details section provides a brief description of each corpus.
Modes
The datasets in Strix are divided into different modes, such as Modern, Parallel, Mink, and many others. These modes are accessible on the Strix platform, located right above the Strix logo on the top-left side, as shown in the figure below. The default mode in Strix is the Modern mode.
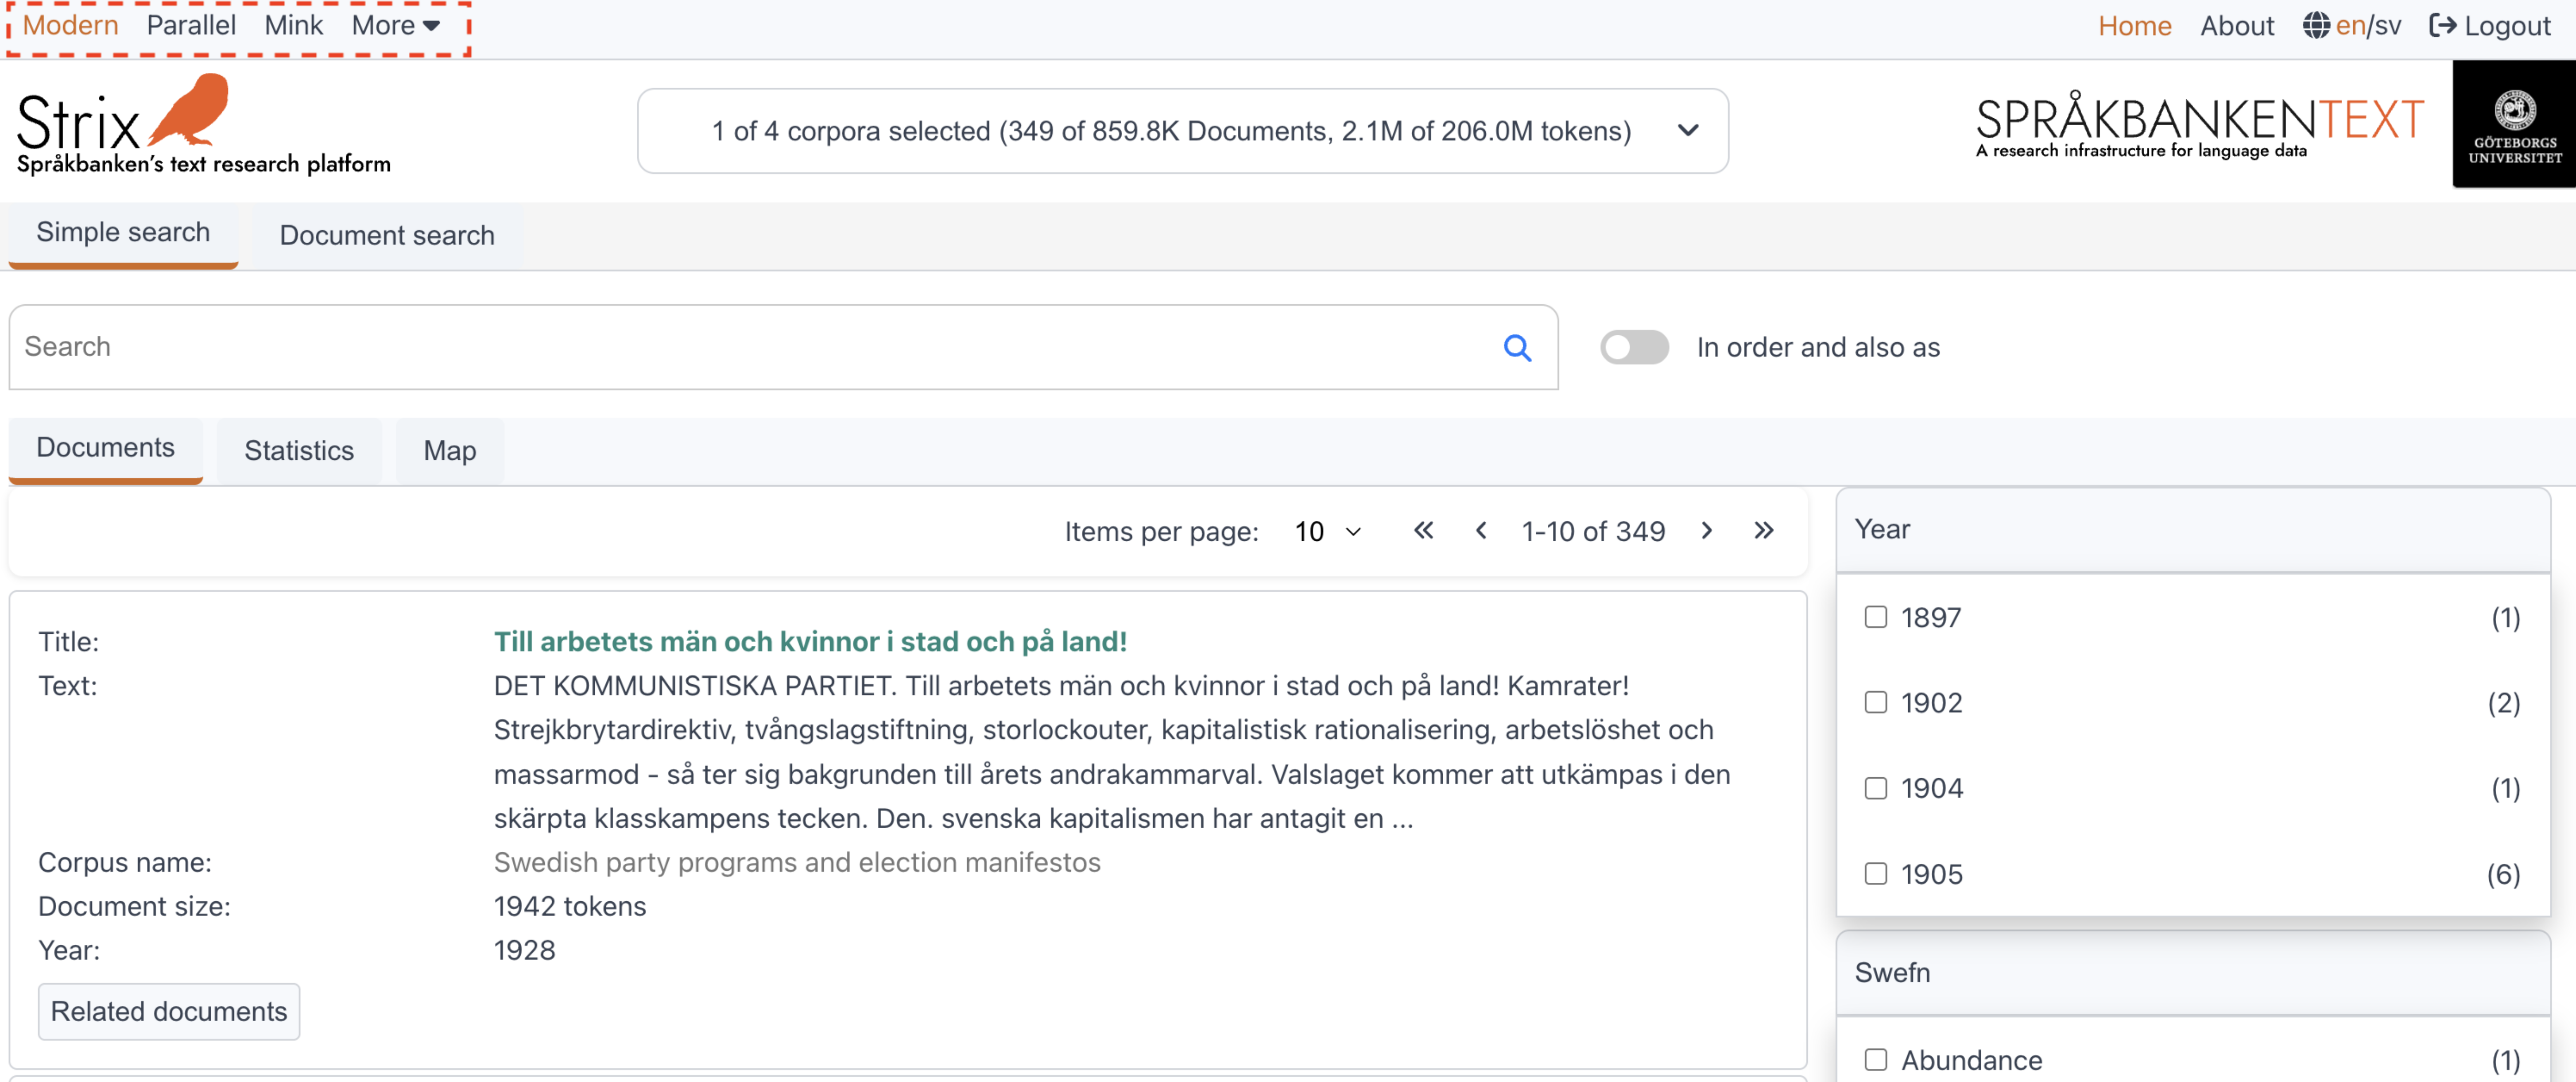
The selected mode is always highlighted with a distinct color. Once a mode is selected, the corpora in the Corpora Selection section are updated to reflect the corpora available in the selected mode. More details about corpora selection can be found in the Corpora section.
Below is a list of modes available in Strix, along with their descriptions and examples:
Modes in Strix
Modern:
This mode contains datasets written in contemporary Swedish (from the 1900s to the present). The datasets in this mode are open access.
Examples of datasets in Modern mode:- Swedish party programs and election manifestos
- Swedish Wikipedia
- Riksdag open data (governmental)
Mink:
This mode is only available if the user is logged into Strix and has one or more personal collections in Strix. It is a protected mode and is not visible to users who are not logged in.Parallel:
The Parallel mode is unique compared to other modes. In this mode, each document has a corresponding reference document. When a user opens a document in this mode, the Codemirror editor displays two documents side by side:- The source document.
- The reference document (linked to the source document).
Why two documents?
The datasets in Parallel mode often involve translations or corrections. Examples include:- Translations from one language to another (e.g., novels, Bible texts).
- OCR-scanned documents normalized using NLP models to correct OCR errors.
- Handwritten essays by students learning Swedish, where:
- The source text is written by the student.
- The target text is normalized and corrected by the teacher.
Examples of datasets in Parallel mode:
- Translated novels
- Bible texts
- OCR-corrected documents
- Student essays with teacher corrections
More:
The More button, located on the far right, is a dropdown menu containing additional modes in Strix. These include:- Detektiva avdelningen
- Jubilee Archive
- The Swedish Literature Bank
For more details about corpora in each mode and their selection, visit the Corpora section.
Corpora
The Data selector (or Corpus selector) is used to choose one or more corpora. Users can find this feature right beside the Strix logo on the top-right side of the platform. When a mode is selected, the default corpora for that mode are automatically selected. However, users can customize their selection by selecting or deselecting corpora based on their preferences and needs.
Every time a corpus is selected or deselected in the Data selector (as shown in the image below), the documents and tables in the Filter section (on the right side) are updated accordingly. More details about the filter section will be covered later.
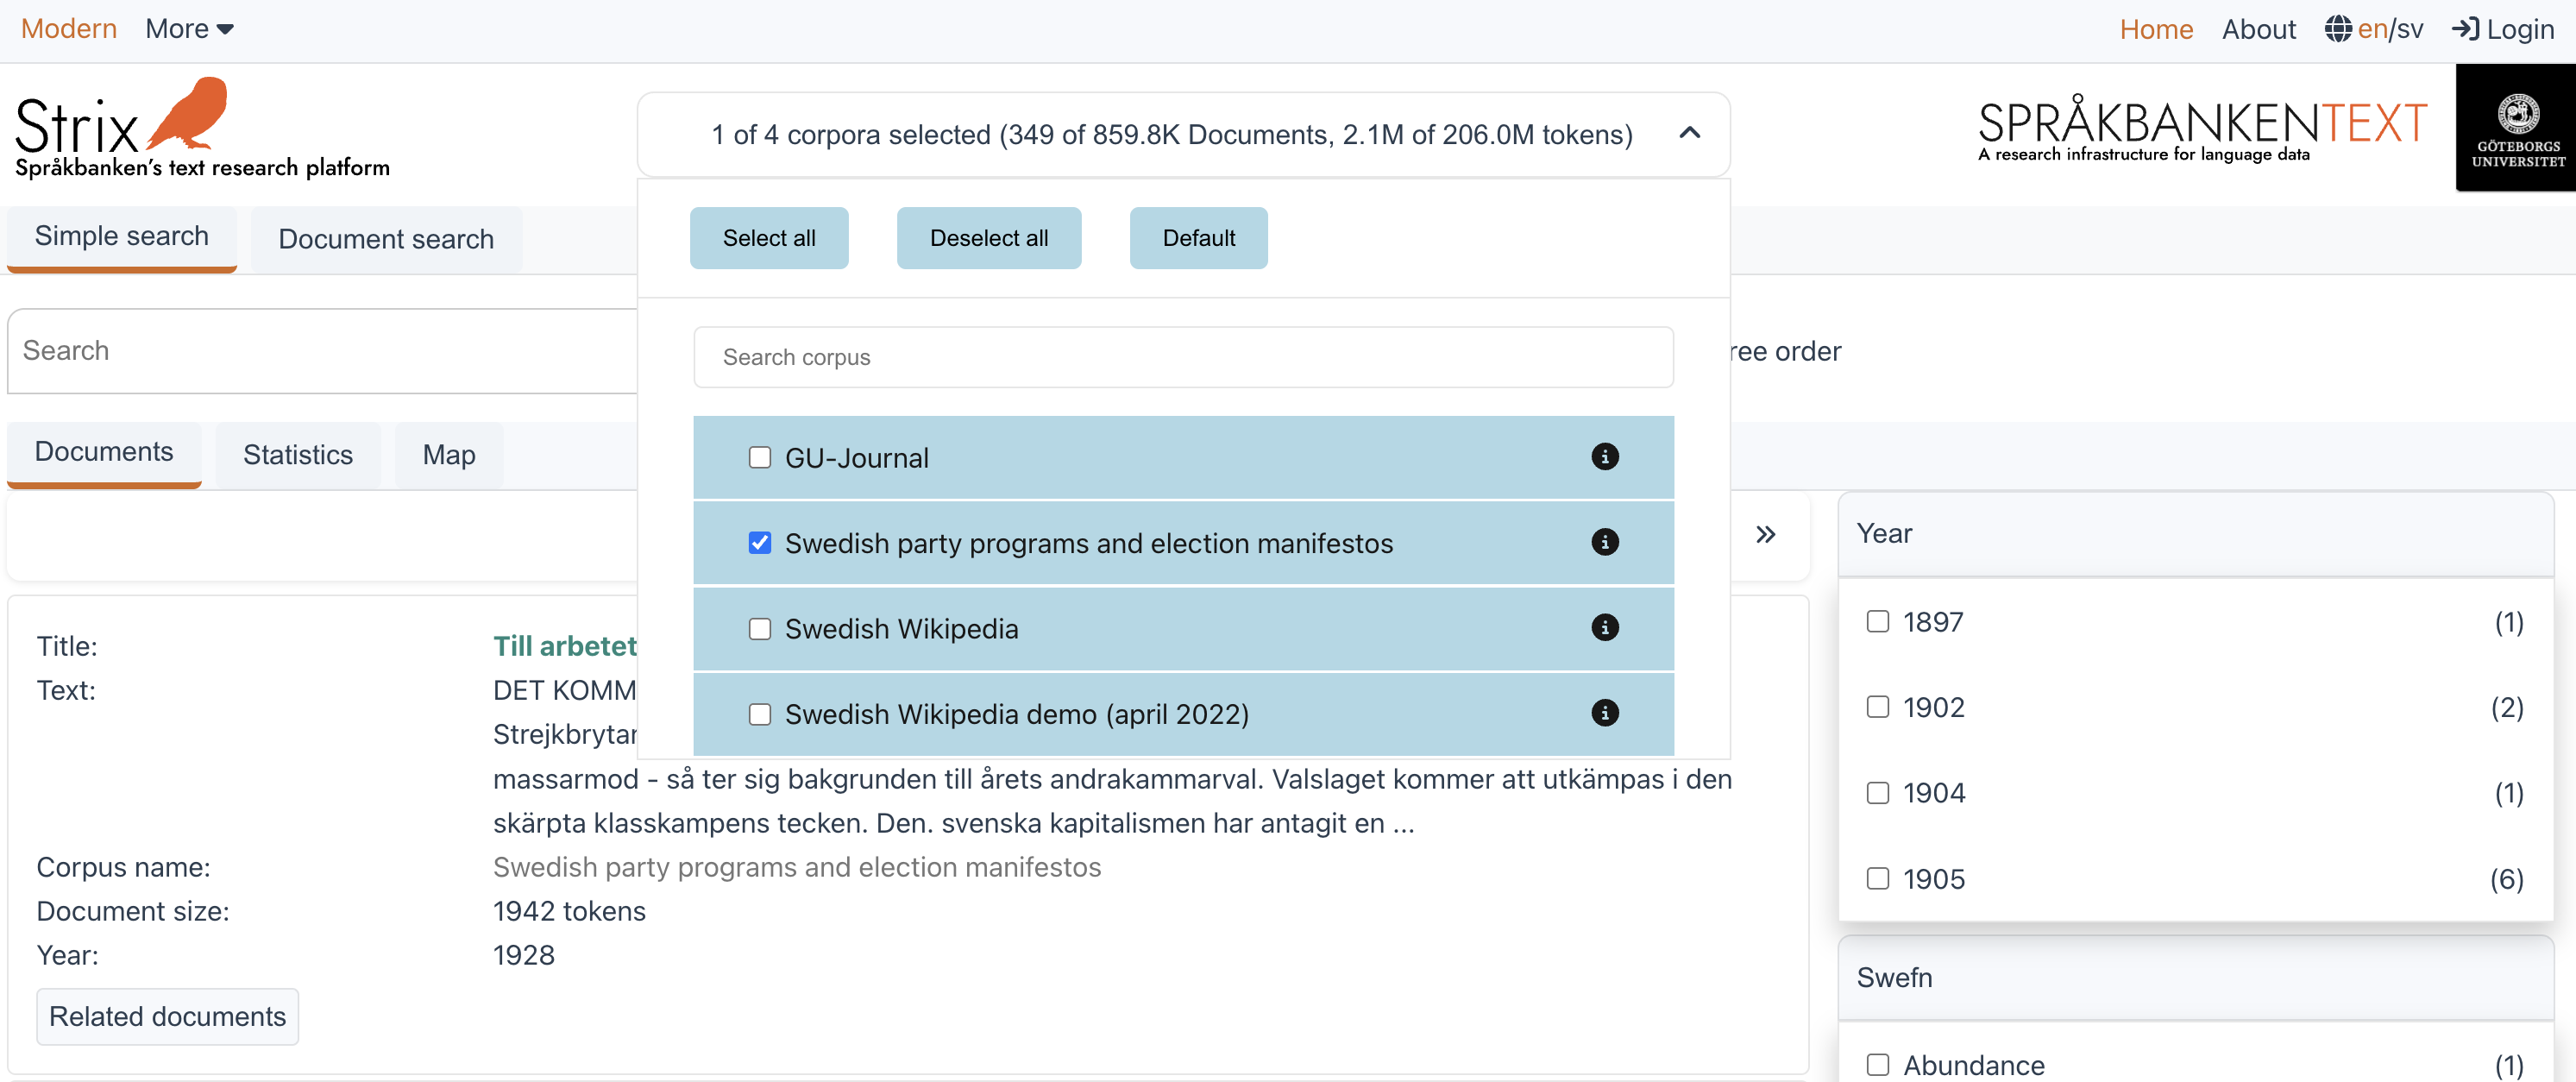
Buttons in the Data selector
The Data selector includes the following buttons to make selection easier:
- Select all: Selects all the corpora in the current mode.
- Deselect all: Deselects all the selected corpora.
- Default: Resets the selection to the default corpora for the currently selected mode.
Searching for corpora
If the list of corpora is long, users can use the Search feature in the Data selector to quickly find the corpus they are looking for. This makes it easier to sort through large collections of corpora.
Corpus information
Each corpus in the Data selector has an info icon button located on the right side of the corpus name. Clicking this button opens a dialog box that provides a detailed description of the corpus. More information about corpus details can be found in the Corpus Details section.
Corpus description
Each corpus in Strix has a default metadata structure. Some corpora may also include additional annotations at the word and text levels. Below is an example of the basic structure of a corpus, using the Swedish party programs and election manifestos corpus as a reference.
Swedish party programs and election manifestos
- Mode: Modern
- Documents: 349
- Corpus Size: 2,099,602 tokens
- Word attributes:
- Lemgram
- Sense
- Compound word forms
- Compound lemgrams
- Dependency relation
- Dephead
- Ref
- Sentiment label
- Text classification (blingbring)
- Text classification (swefn)
- Baseform
- Msd
- Part-of-speech
- Text attributes:
- Text classification (blingbring)
- Text classification (swefn)
- Readability measure (LIX)
- Readability measure (ovix)
- Readability measure (nk)
- Id
- Party
- Type
- Year
- Structural attributes:
- Name tag:
- Expression
- Name
- Type
- Subtype
- Sentence
- Location
This metadata structure provides a comprehensive overview of each corpus in Strix, enabling users to perform detailed analyses at both the word and text levels. For more information about how to use these attributes, refer to the relevant sections in the documentation.
Search
The search functionality in Strix is divided into two parts: Simple search and Document search.
Simple search:
Simple Search allows users to search for specific words or word forms. It also supports searching for expressions or phrases. More details about Simple Search can be found on the Simple Search page.Document search:
Document Search uses vector search techniques to find vectors that are semantically close to the given query vector. The query vector can be a word, sentence, or document. More details about Document Search are explained in the Document search section.
Simple search
Simple Search allows users to search for an exact word, word form, or phrase. The resulting documents from the search are displayed in the section below the search bar. Let’s explore the different functionalities of Simple Search.
Search for a word
This is a basic search where users can type a word and press the search button to retrieve documents. The search highlights the exact word entered in the documents.
Example:
Searching for the word klimat in the Swedish party programs and election manifestos corpus.
Search example: klimat
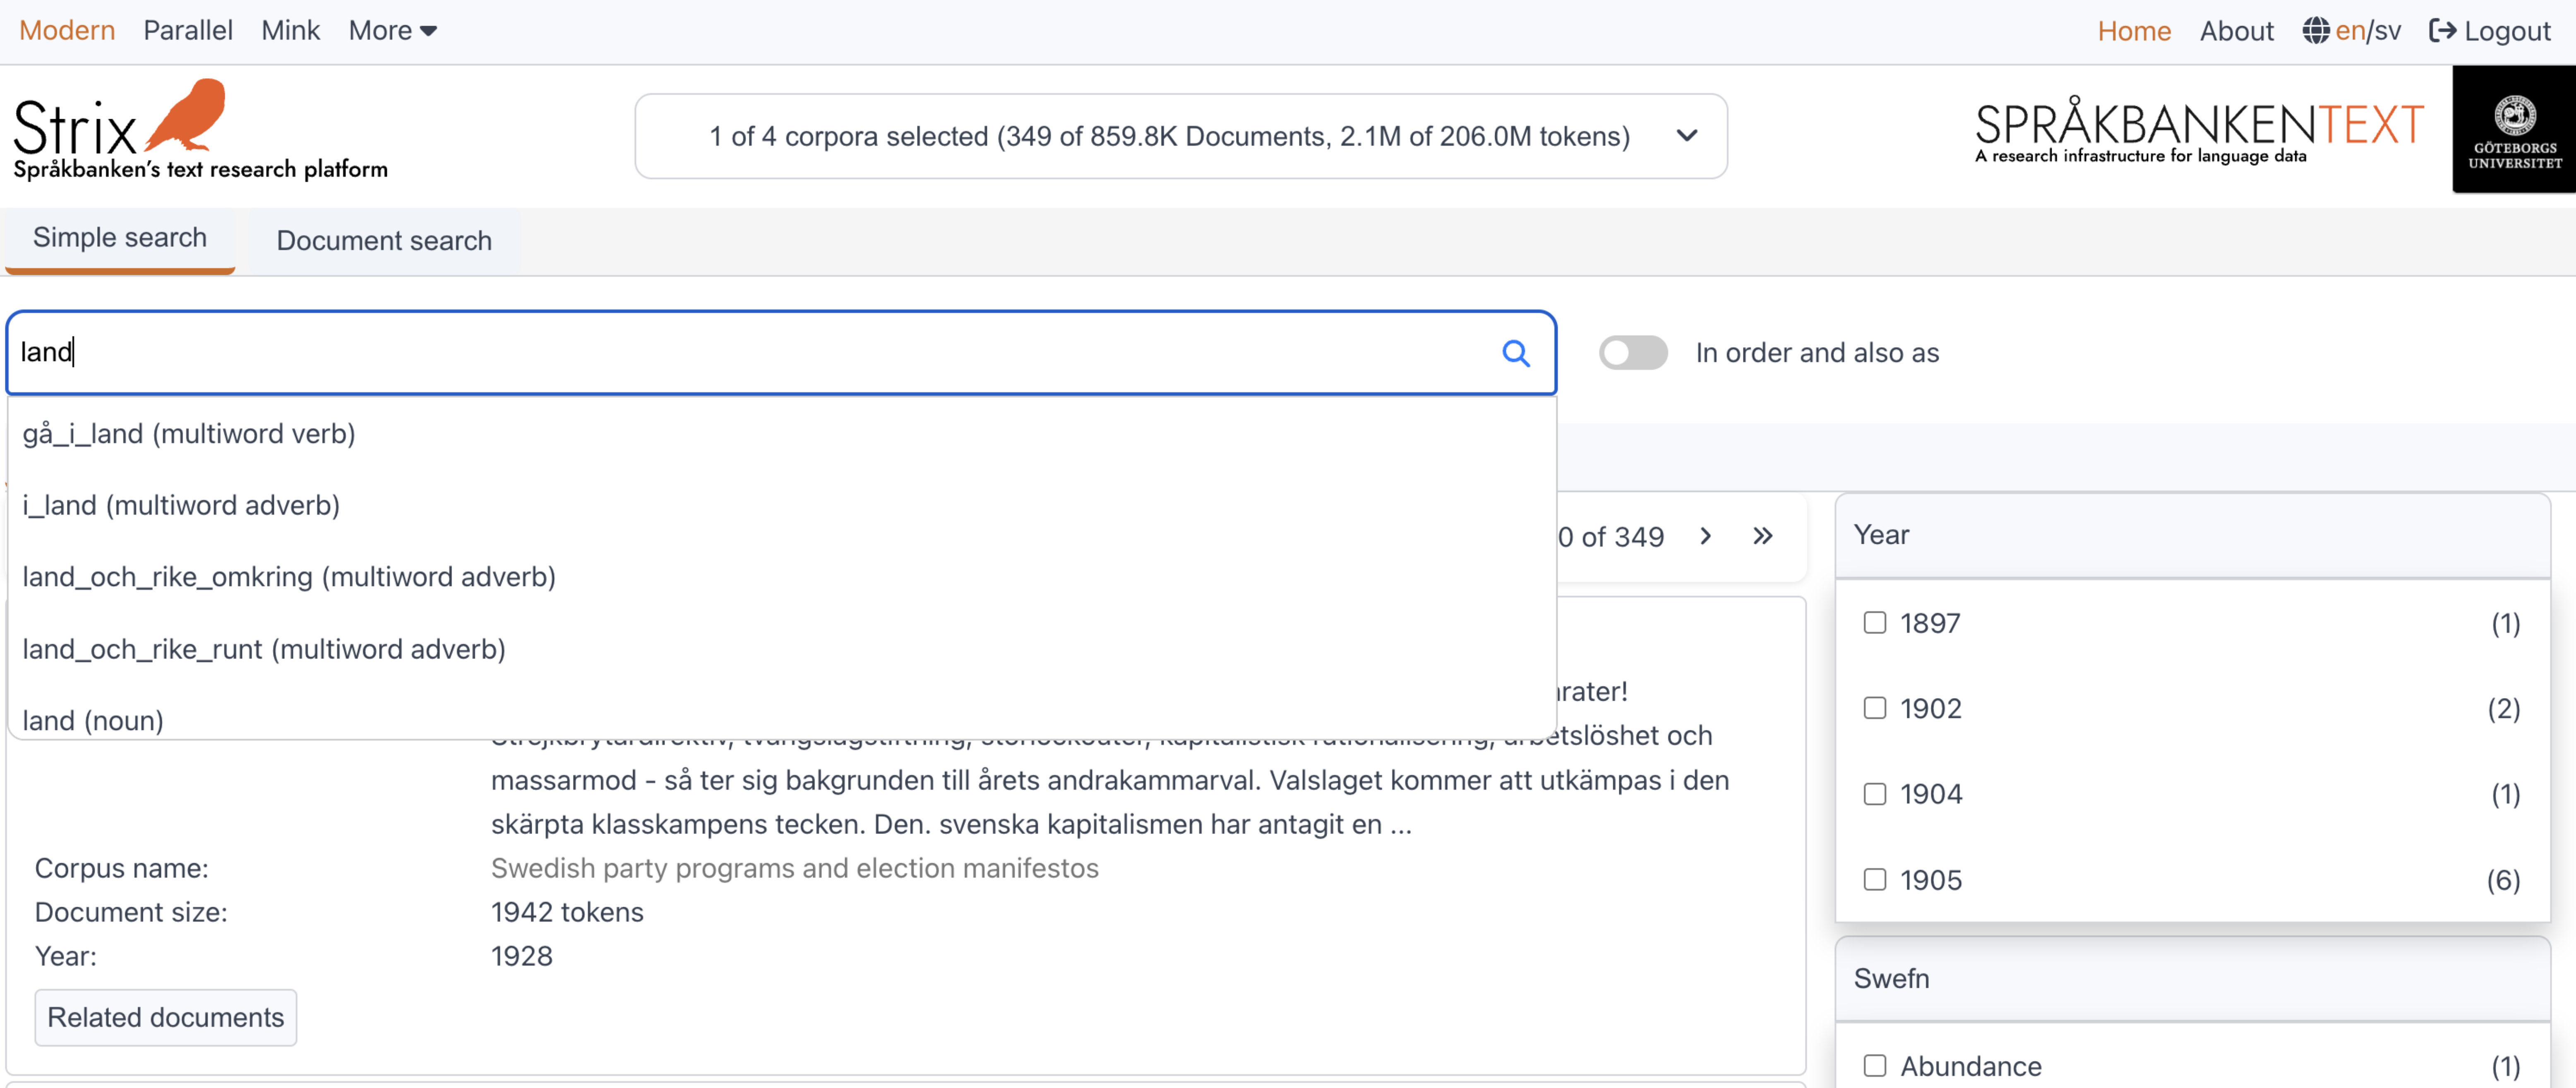
Search for a word form
Instead of searching for an exact word, users can search for a word form (e.g., lemma or lemgram). When users start typing, the query is sent to the Karp API, which returns lemgrams for the input word. These lemgrams are displayed in a dropdown below the input field. Users can select one of the word forms and search for it.
Example:
Searching for the word form land (noun) in the Swedish party programs and election manifestos corpus.
Search example: land (noun)
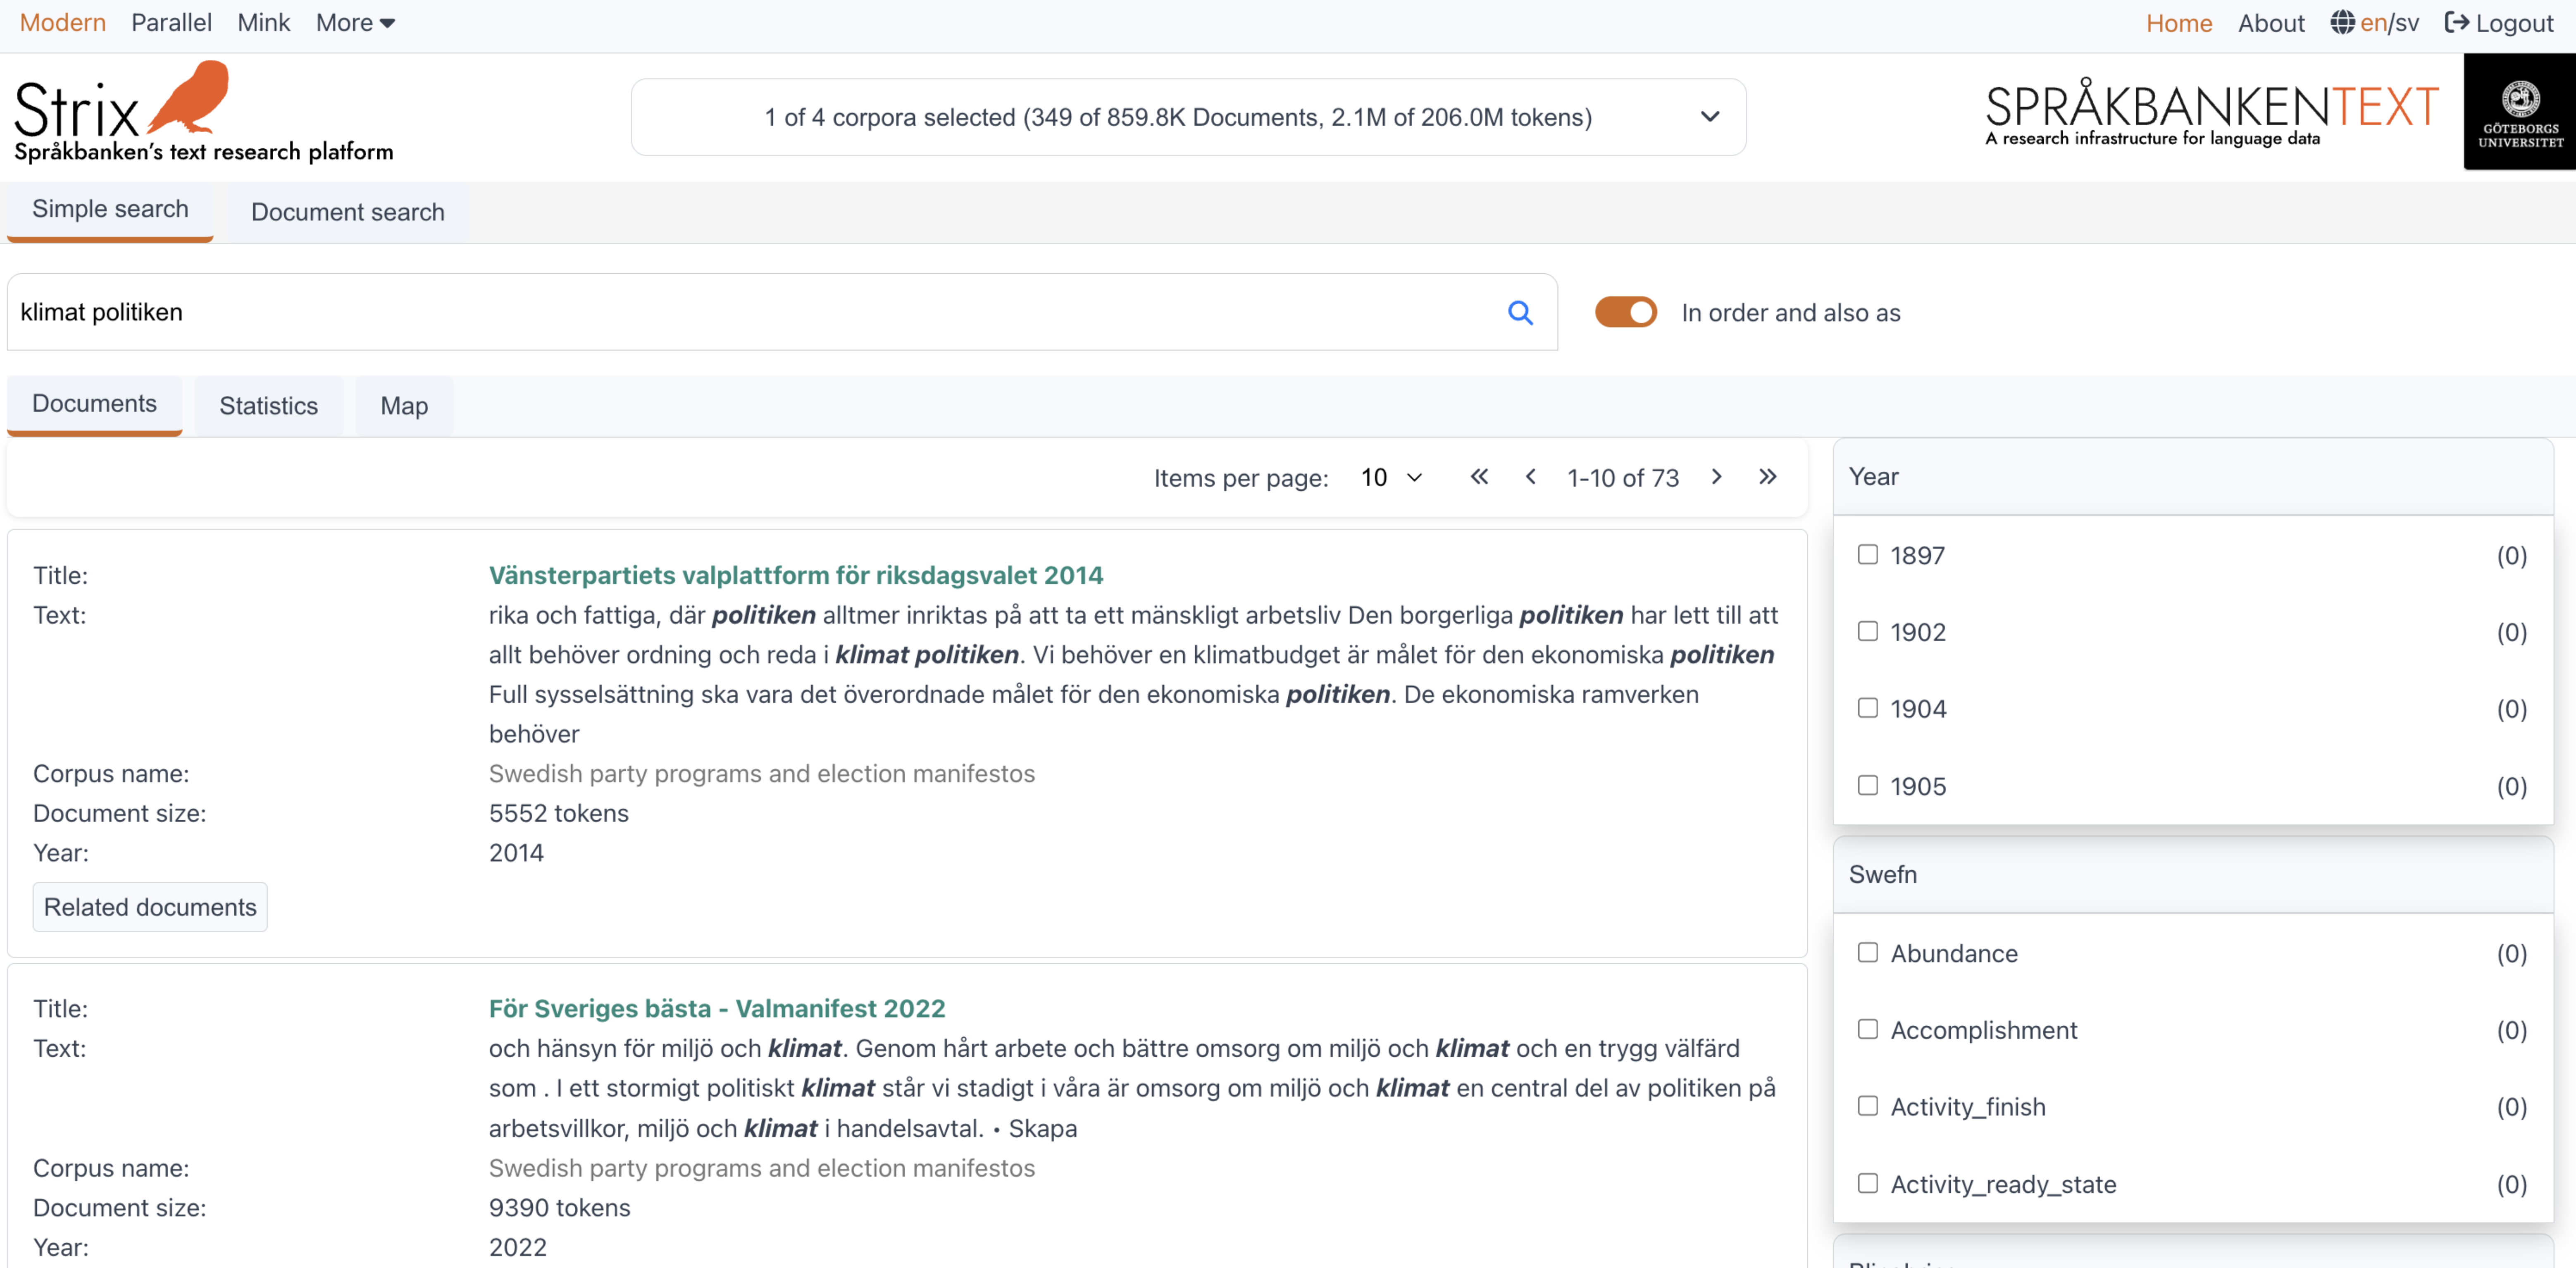
Search for an exact phrase or words in a phrase
Users can also search for a phrase instead of a single word or word form. To enable phrase search, users need to activate the toggle button located to the right of the search input field. This allows searching for an exact phrase or specific words within the phrase.
Example:
Searching for the phrase "klimat politiken" in the Swedish party programs and election manifestos corpus.
Search example: "klimat politiken"
Document search
Every document in Strix has a document vector. These vectors are used in the document search functionality. At search time, the search query is converted into a vector and compared to the document vectors. The fifty closest documents to the query are returned.
These documents are the ones that are semantically close to the given vector query, as shown in the figure below. The current default number of documents that the document search returns is limited to 50, but this number will be a dynamic input instead.
KBLab's KB-SBERT is used to create the vectors and also to perform the document search. This means that the search does not look for exact matches of the query but instead finds documents that are semantically similar to the query based on vector representations.
Users can search for a word, phrase, sentence, or even a whole document. Below are some examples:
Examples
Word search
Query: klimat
Result: Documents in Swedish party programs and election manifestos that are semantically related to the word "klimat."Phrase search
Query: klimat politik
Result: Documents in Swedish party programs and election manifestos that are semantically related to the phrase "klimat politik."Sentence search
Query: Våra barn kommer att fråga oss vad vi gjorde när vi insåg vidden av klimathot och miljöförstöring
Result: Documents in Swedish party programs and election manifestos that are semantically similar to the sentence.Document search
Query: A full document text.
Result: Documents with content or context that is semantically similar to the provided document.
Filters
Filters in Strix are one of the core functionalities, playing a crucial role in narrowing down search results. When working with a large collection of documents from various genres, such as newspapers, historical texts, and more, filters allow users to refine their search queries and focus on specific subsets of documents based on predefined criteria.
How filters work
Filters in Strix are designed to support advanced and complex filtering capabilities. Users can scroll through the available options in each metadata filter to refine their search. Here's how it works:
Indexing metadata
Each document in the collection is indexed with metadata at three levels:- Text level: Metadata such as genre, newspaper, year, author, topics, and more.
- Sentence level: Metadata such as named entities and geo-locations.
- Word level: Metadata such as part of speech, word form, sentiment analysis, and more. (More details about word-level metadata can be found in the Document section.)
Applying filters
When a user applies a filter (e.g., selecting "year," "topics," or other metadata), Strix uses the indexed metadata to narrow down the search results to documents that match the filter criteria.Combining filters
Users can combine multiple filters to refine their search further. For example, they can filter for "newspapers" published in 1905.Efficient query execution
The filtering process is optimized to ensure that filters are applied quickly and efficiently. This allows users to refine their searches seamlessly, even when working with large datasets like Wikipedia, which contains more than 800,000 documents in the Swedish language.
Examples of filters
Year filter
Focus on documents from a specific year, such as "1920."
Search Example: Year 1920
(Example corpus: Swedish Party Programs and Election Manifestos)Text classification (SweFN)
Retrieve documents with a specific topic, such as "Satisfying."
Search example: SweFN topic - Satisfying
(Example corpus: Swedish Party Programs and Election Manifestos)Text Classification (Blingbring)
Search for documents with a specific Blingbring topic, such as "afton."
Search example: Blingbring topic - Afton
(Example corpus: Detektivaavdelningen)
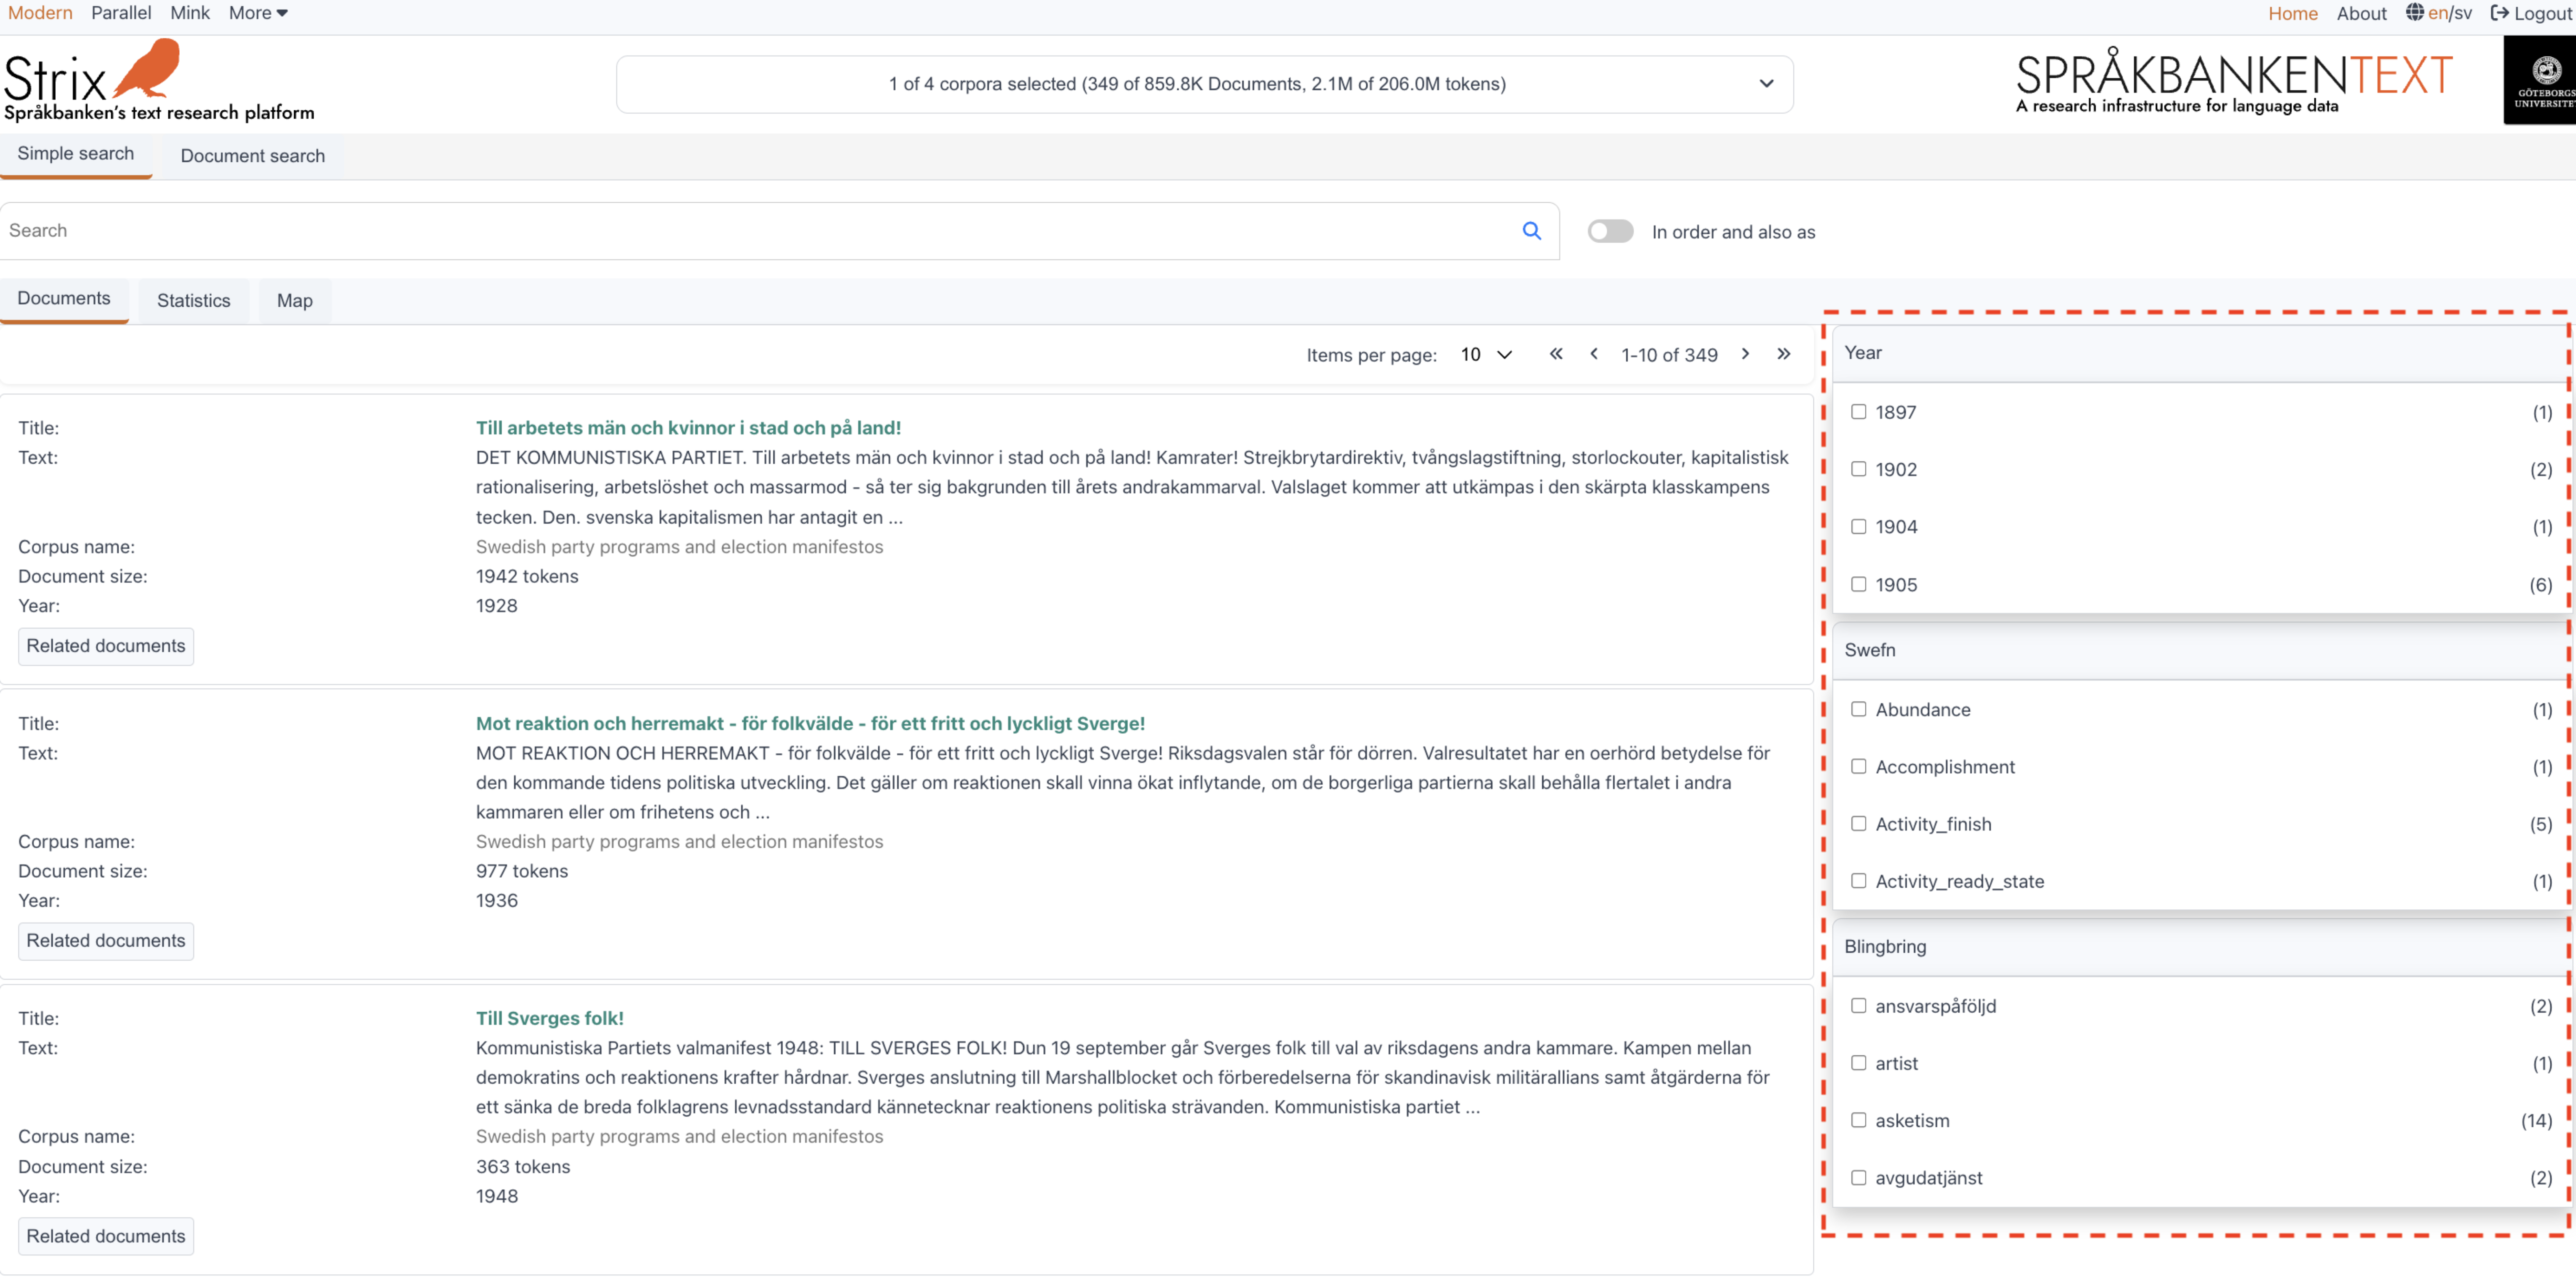
Standard filters
Currently, the Year, Text classification (SweFN), and Text classification (Blingbring) filters are available on the right-hand side of the interface, as shown in the figure below. These are referred to as Standard filters and provide quick access to commonly used filtering options.
Advanced filters
For Advanced search, all indexed metadata will be available as filtering options. Since each collection contains a vast amount of metadata, it is challenging to fit all options on the main page. Advanced filters provide a more comprehensive filtering experience, allowing users to refine their search using the full range of metadata attributes.
Filters empower users to explore and analyze large collections of documents effectively, making it easier to derive insights and find relevant information.
Data visualization
Data visualization in Strix provides users with powerful tools to explore and analyze large collections of documents in an intuitive and interactive way. It is divided into three main sections:
Documents
This section is a collection of documents, similar to how Google displays search results. When users search in Strix, they get a list of documents from the selected collections. The documents are shown with a preview only, allowing users to quickly scan the content. When a user clicks on a document, the full document opens, providing detailed insights into its structure, semantics, and key information.Statistics
The statistics section currently displays data in tabular format, helping users understand the distribution and frequency of metadata like genres, publication years, authors, and more. While graphs and charts are not available yet, they will be introduced in future updates to provide visual summaries and make data analysis even more intuitive.Maps
The maps section enables users to visualize geographical data associated with the documents. By plotting named entities or geo-locations on a map, users can explore spatial patterns and relationships within the dataset.
Each of these sections is designed to provide a unique perspective on the data, making it easier to uncover insights and gain a deeper understanding of the information in the Strix collections.
Explore the subsections to learn more about how each visualization tool works and how it can help you analyze your data effectively.
Documents
This section is a collection of documents, similar to how Google displays search results. When users search in Strix, they get a list of documents from the selected collections. The documents are shown with a preview only, allowing users to quickly scan the content. When a user clicks on a document, the full document opens, providing detailed insights into its structure, semantics, and key information.
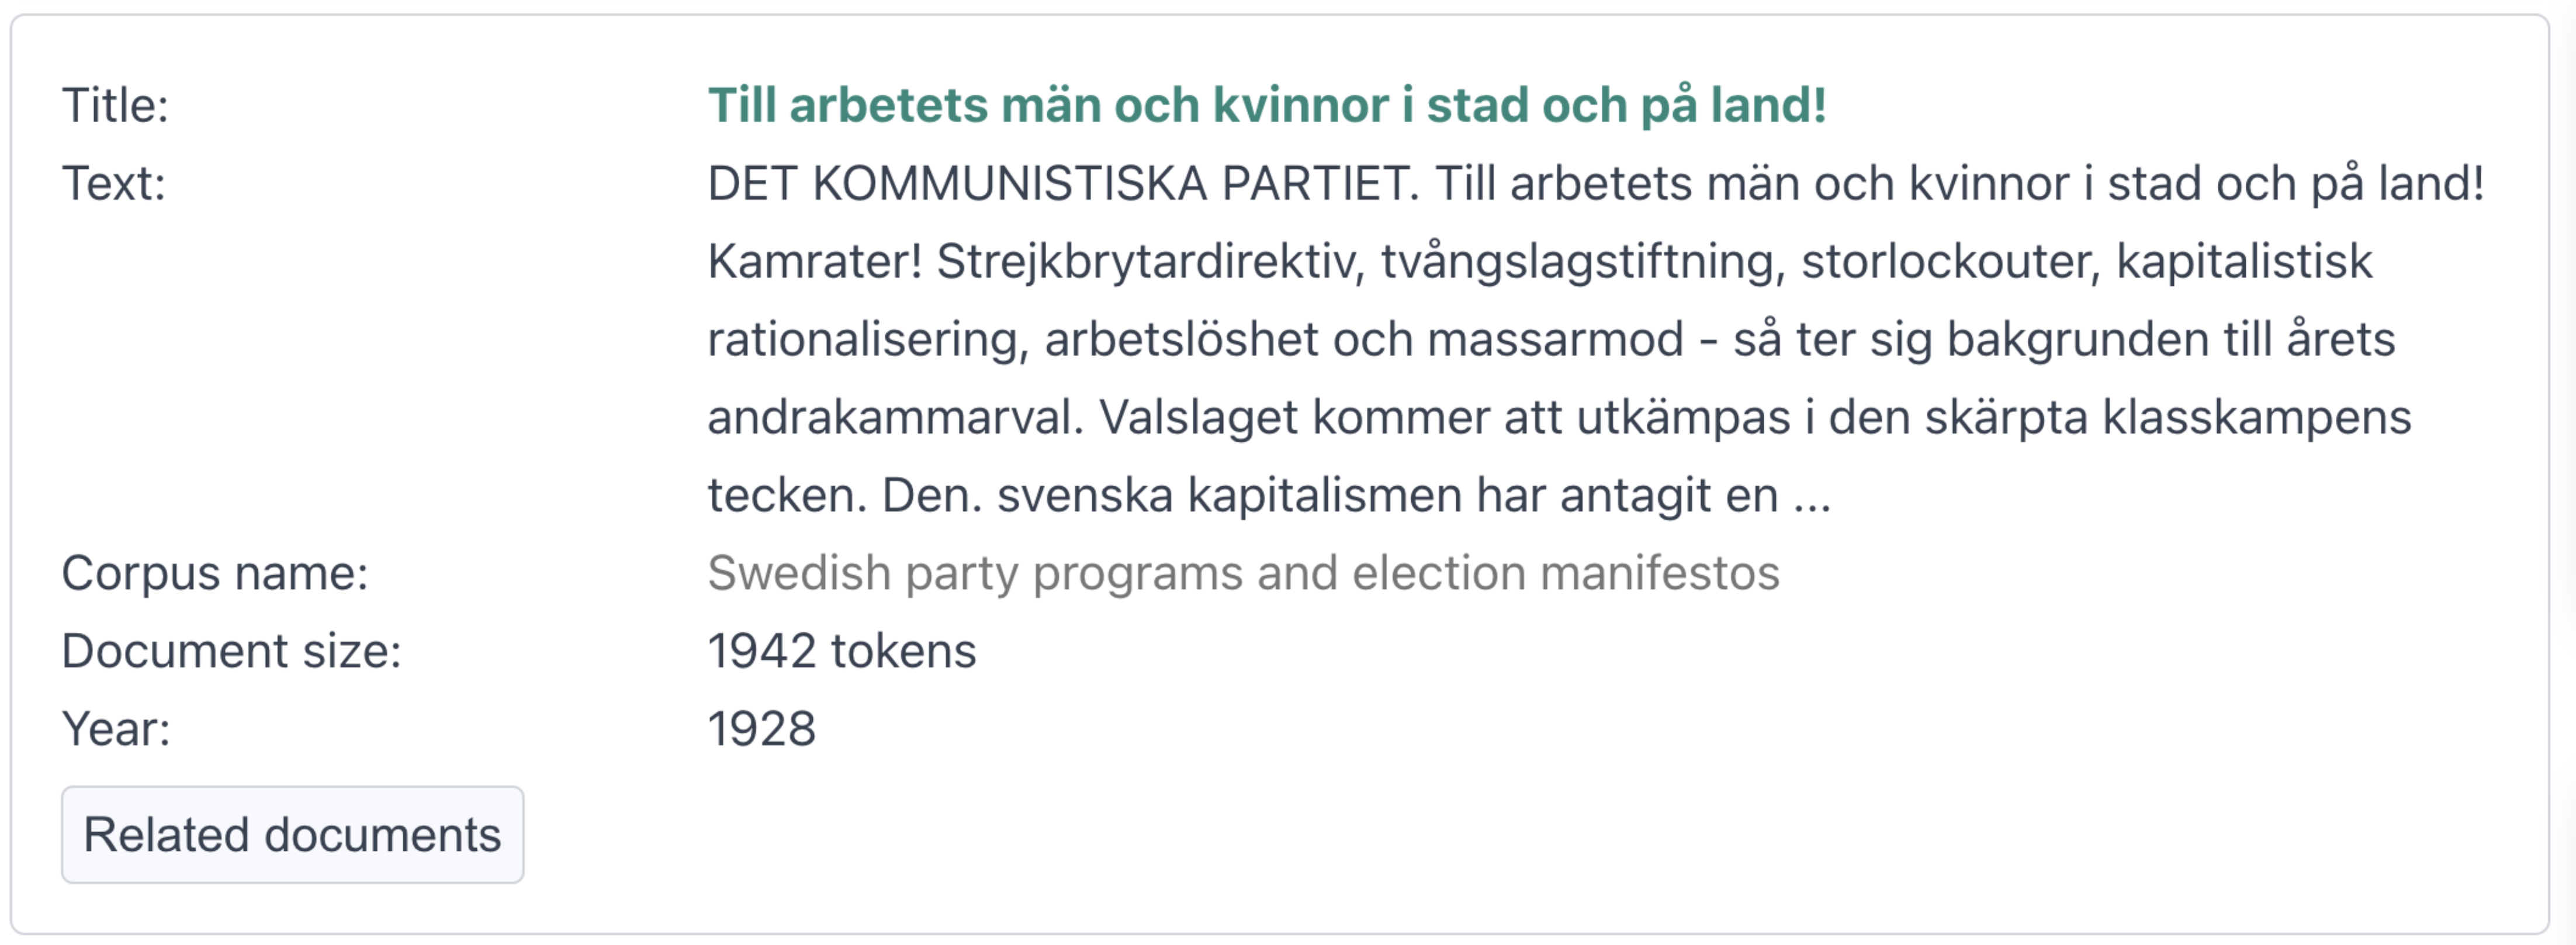
Each document in the collection is displayed as shown in the figure below. Here’s what users can expect to see for each document:
Title
The title of the document. A quick glance at the title gives users an idea of the document's content.Text
A preview of the text in the document (usually the first 50 tokens). This snippet helps users decide if the document is relevant to their search.Corpus name
The name of the collection that the document belongs to. This helps users identify the source of the document.Document size
The number of tokens (words or word-like units) in the document. A handy detail for understanding the document's length.Year
The year the document was created, based on metadata. Note: Some documents may not have year information if it’s missing in the metadata.Related documents
A button that opens a tab right beside the Maps section. This tab displays the top 50 other documents in the collection that are semantically close to the current document. Perfect for exploring similar content!Link
Some collections provide a link to the source of the document. If a URL is available in the metadata, it will be displayed here for easy access.
This layout ensures that users can quickly scan and interact with the documents, making it easier to find relevant information and explore related content. Dive in and discover the power of Strix's document visualization!
Statistics
The Statistics section in Strix provides users with the ability to explore metadata attributes and their elements, showing how many documents in a collection belong to a particular element. The statistics view is divided into two parts, as shown in the figure below:
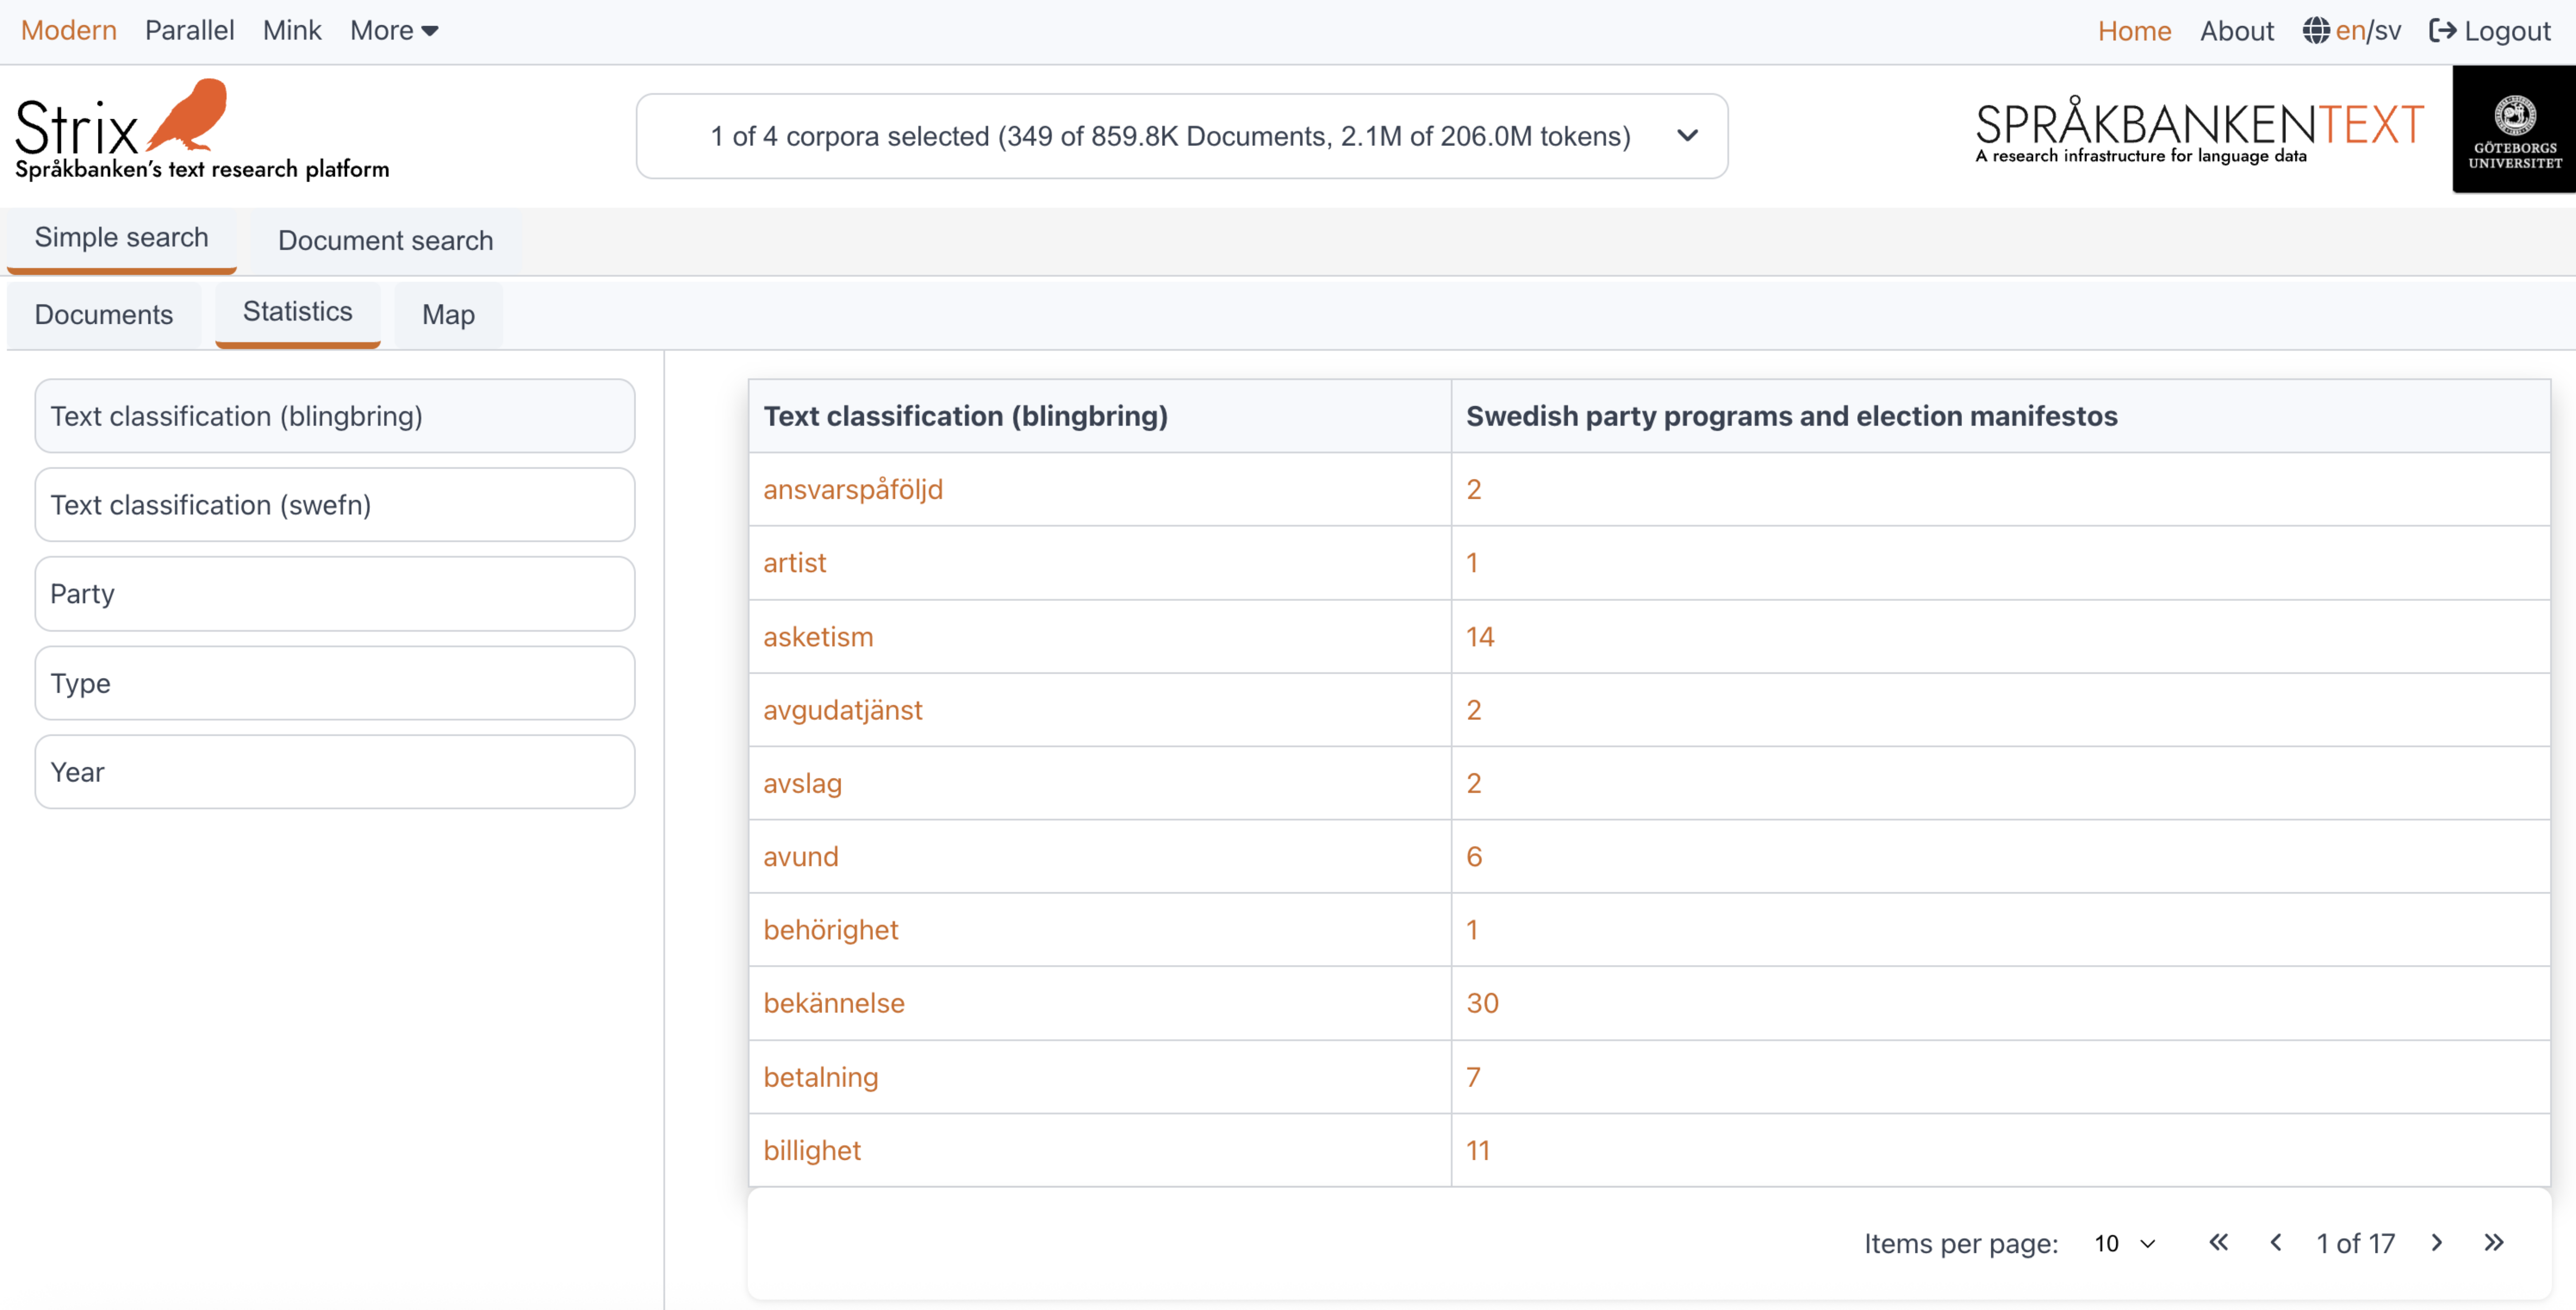
On the left side, users can see the metadata attributes available in the selected collections. On the right side, a tabular view displays the statistics for the selected metadata attribute. Below is a detailed explanation of these two parts and how they work.
Metadata section
The left side of the statistics view contains a list of metadata attributes. This list updates dynamically whenever a collection is selected or deselected. The list represents the union of metadata attributes available across the selected collections.
- By default, the metadata attribute "Text classification (Blingbring)" is selected when the user navigates to the statistics page.
- The table on the right updates automatically whenever a new metadata attribute is selected from this list.
This dynamic behavior ensures that users always see the most relevant metadata attributes for their selected collections.
Table view
The right side of the statistics view displays a table with the statistics for the currently selected metadata attribute. The table is structured as follows:
First column:
This column lists the elements of the currently selected metadata attribute (e.g., elements in "Blingbring" as shown in the figure). These elements update dynamically whenever the user selects or deselects a collection.Second column:
This column represents the first collection that the user selected. It shows the frequency of each element in that collection.Dynamic columns:
Columns beyond the second are added or removed dynamically based on the user's selection or deselection of collections. Each column corresponds to a selected collection and shows the frequency of the elements in that collection.
Interactive features
Each value and frequency in the table is color-coded for interactivity:
Black text:
Indicates that the value is not clickable. This occurs when an element in the selected metadata attribute has a frequency of0.Colored text:
Indicates that the value is clickable. Clicking on these values opens a new tab right after the Maps section, displaying the documents associated with the selected element or frequency.
Click behavior:
Clicking on an element:
Displays all documents across the selected collections that contain the element.Clicking on a frequency:
Displays the documents from the specific collection that contain the element with the selected frequency.
This intuitive design allows users to explore metadata attributes and their elements in detail, making it easier to analyze and navigate large collections of documents.
Maps
The Maps section in Strix enables users to visualize geographical data associated with the documents. By plotting geo-locations on a map, users can explore spatial patterns and relationships within the dataset. The map dynamically updates every time the user selects one or more collections, displaying the geo-locations mentioned in the documents from the selected collections.
Key features
Interactive geo-locations
Each geo-location is represented as a point on the map. These points are clickable, allowing users to view detailed information about the number of documents that mention the specific geo-location. If multiple collections are selected, the document counts are separated and displayed in a tabular format for clarity (as shown in the figure below).Users can click the "Show hits" button to open a new tab right beside the Maps tab. This tab lists all the documents where the selected geo-location is mentioned.
Handling large datasets
Collections like Wikipedia, which contain hundreds of thousands of geo-locations, are efficiently visualized using clusters:- Standalone points: If a geo-location has no other nearby locations, it is displayed as an individual point.
- Clusters: When multiple geo-locations are close to each other, they are grouped into a cluster. The cluster displays a number indicating how many geo-locations are in that area.
As users zoom in, clusters break apart into individual points, providing a more granular view. Conversely, as users zoom out, the points merge back into clusters for a cleaner, high-level overview.
Example view
This intuitive and interactive design allows users to explore geographical data effectively, whether they are analyzing a small dataset or navigating through massive collections like Wikipedia. The combination of points, clusters, and detailed document views ensures that users can uncover spatial patterns and relationships with ease.
Document view
The Document view section in Strix provides users with tools to explore and analyze individual documents in detail. It is divided into two main parts:
Document reader
This section focuses on visualizing the content of documents, allowing users to explore patterns, trends, and relationships within the text. It provides tools to highlight key information and gain insights into the structure and semantics of the documents.Document statistics
This section displays the statistics of each word-level metadata attribute for the entire document in a tabular format. Users can analyze word-level details such as part of speech, sentiment, and more, providing a deeper understanding of the document's linguistic and semantic properties.
Explore the subsections to learn more about how each part of the Document reader works and how it can help you analyze individual documents effectively.
Document reader
The Document reader page in Strix allows users to explore the full content of a selected document in detail. This section focuses on visualizing the content of documents, allowing users to explore patterns, trends, and relationships within the text. It provides tools to highlight key information and gain insights into the structure and semantics of the documents.
Keyfeatures
Full document display
Users can view the entire content of the document, including all text and metadata. This provides a complete overview of the document's structure and content.Interactive tabs
The document view includes two tabs:- Document tab: Displays the full content of the document.
- Statistics tab: Provides word-level metadata statistics for the document (accessible via the
Document statisticssection).
Users can switch between these tabs to explore the document's content and its metadata.
Annotations and Search
- Annotations selector: Users can navigate through specific annotations or highlights within the document.
- Search in document: A search feature allows users to find specific words or phrases within the document.
Word metadata
Clicking on a word in the document displays its metadata, such as part of speech, lemma, and other linguistic attributes. This feature is particularly useful for detailed linguistic analysis.Parallel document mode
For collections that support parallel documents, users can view two documents side by side. This is especially helpful for comparative analysis, such as translations or aligned texts.Mobile-friendly design
The document view is optimized for mobile devices, with features like collapsible metadata panels and responsive layouts to ensure a seamless experience.
Example view
Below is an example of the Document reader interface, showing the document content, metadata, and interactive features:
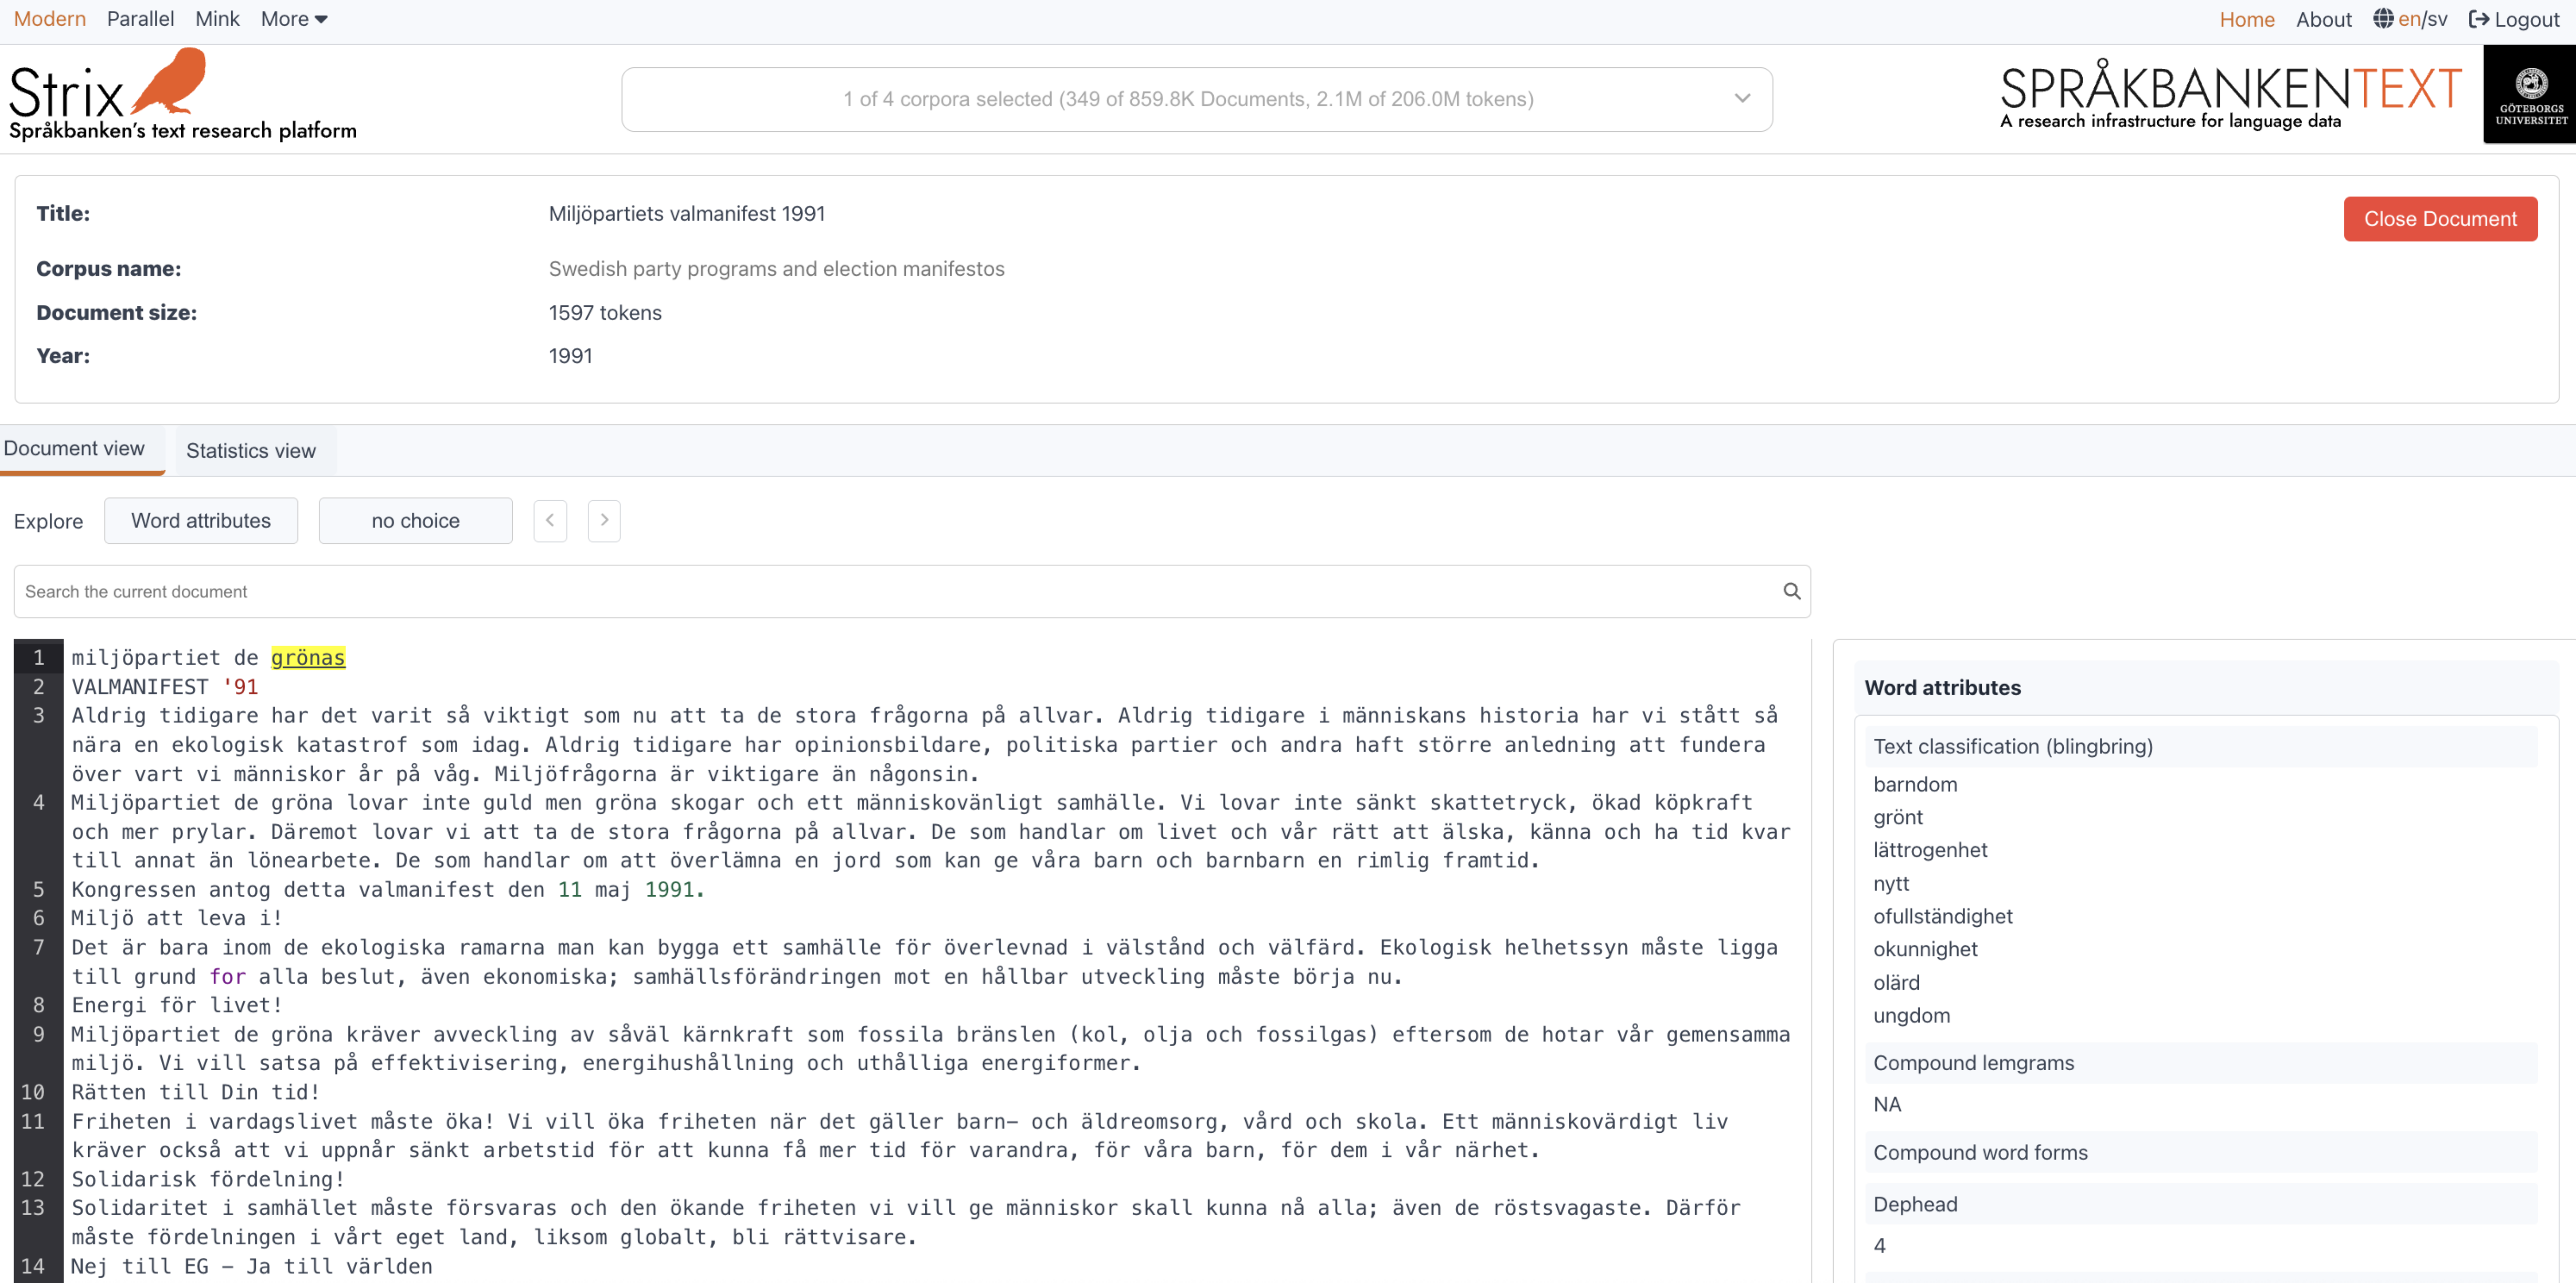
This page is designed to give users a comprehensive view of individual documents, making it easier to analyze and extract meaningful insights. Whether you're exploring a single document or comparing parallel texts, the Document reader provides all the tools you need for in-depth analysis.
Document statistics
The Document statistics page in Strix provides users with detailed insights into the word-level metadata attributes of a document. This section displays the statistics in a tabular format, allowing users to analyze linguistic and semantic properties of the document.
Key features
Word-level metadata attributes
Users can explore various word-level metadata attributes, such as part of speech, lemma, sentiment, and more. These attributes provide a deeper understanding of the document's linguistic structure.Dynamic attribute selection
- A list of available word-level metadata attributes is displayed on the left side of the interface.
- Users can select an attribute to view its statistics in the table.
- By default, the first attribute in the list is selected when the page loads.
Tabular statistics
The statistics for the selected metadata attribute are displayed in a table on the right side. The table includes:- Attribute elements: The unique values or elements of the selected metadata attribute (e.g., specific parts of speech or lemmas).
- Frequency: The number of occurrences of each element in the document.
Filtering and agination
- Users can filter the table by entering a keyword in the search box to narrow down the results.
- Pagination controls allow users to navigate through large datasets, with options to adjust the number of items displayed per page.
Interactive design
- The interface is responsive and optimized for both desktop and mobile devices.
- On mobile, a dropdown menu is used for selecting metadata attributes, ensuring a seamless experience.
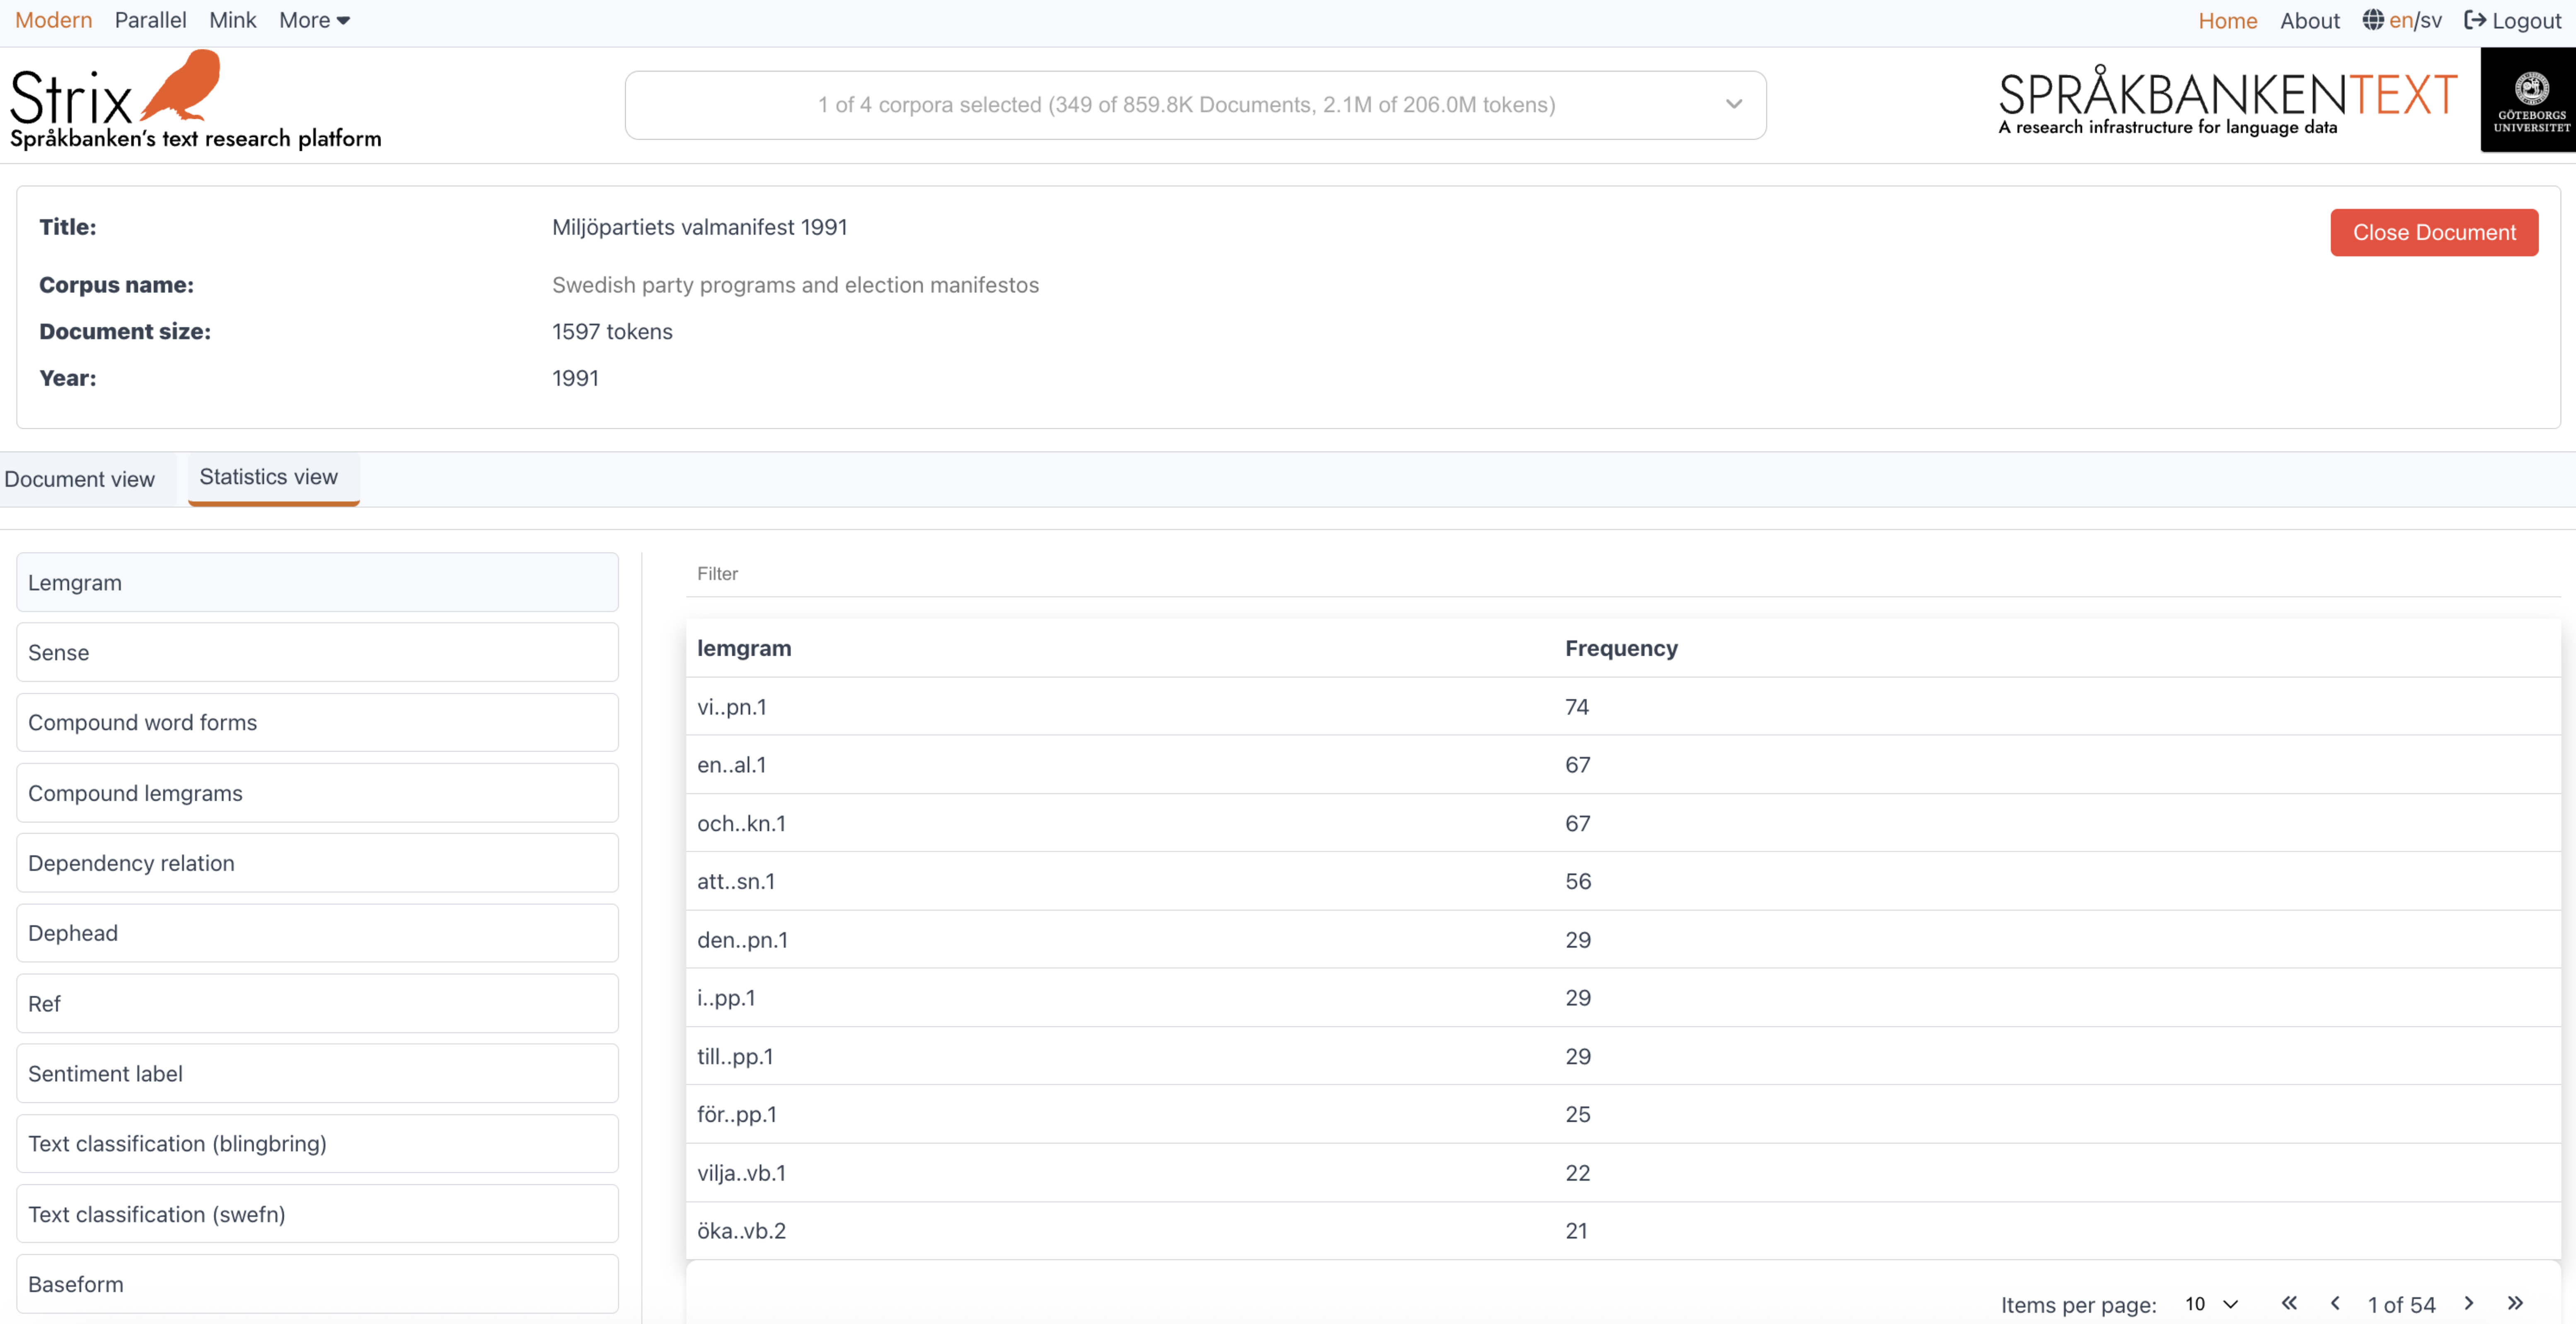
Example view
Below is an example of the Document statistics interface, showing the metadata attributes and their statistics:
How it works
Selecting a metadata attribute
- On desktop, users can click on an attribute from the list on the left.
- On mobile, users can select an attribute from the dropdown menu.
- The table updates dynamically to display the statistics for the selected attribute.
Filtering the data
- Enter a keyword in the search box to filter the table and display only the relevant elements.
- The filtering is case-insensitive and works across all elements in the table.
Navigating the table
- Use the pagination controls to navigate through the table.
- Adjust the number of items displayed per page using the dropdown menu.
This page is designed to provide users with a detailed and interactive way to analyze the word-level metadata of a document, making it easier to uncover linguistic patterns and insights.
Related documents
The Related documents section in Strix allows users to explore documents that are semantically similar to a selected document. This feature is designed to help users uncover connections, patterns, and relationships across the dataset, enabling deeper analysis and discovery.
Key features
Top related documents
- Strix retrieves a ranked list of related documents based on semantic similarity.
- Users can view the top 10, 20, 25, or 50 related documents, depending on their selection.
- Each related document is displayed with key details, including its title, snippet, and similarity score.
Interactive document preview
- Each related document includes:
- Title: The title of the document.
- Snippet: A short excerpt or highlighted text from the document to provide context.
- Corpus name: The collection to which the document belongs.
- Token count: The number of tokens (words or word-like units) in the document.
- Year: The year the document was created (if available).
- Source link: A clickable link to the document's source (if provided in the metadata).
- Each related document includes:
Graph visualization
- For certain modes, users can visualize the relationships between the selected document and its related documents using a graph view.
- The graph displays nodes (documents) and edges (connections), with the size and color of nodes representing their similarity scores and metadata attributes.
- Users can toggle between the graph view and the document list view for flexibility.
Filtering and pagination
- Users can filter related documents by metadata attributes such as corpus, year, SweFN, and Blingbring.
- Pagination controls allow users to navigate through the list of related documents, with options to adjust the number of items displayed per page.
Mobile-friendly design
- The interface is optimized for mobile devices, ensuring a seamless experience with responsive layouts and collapsible controls.
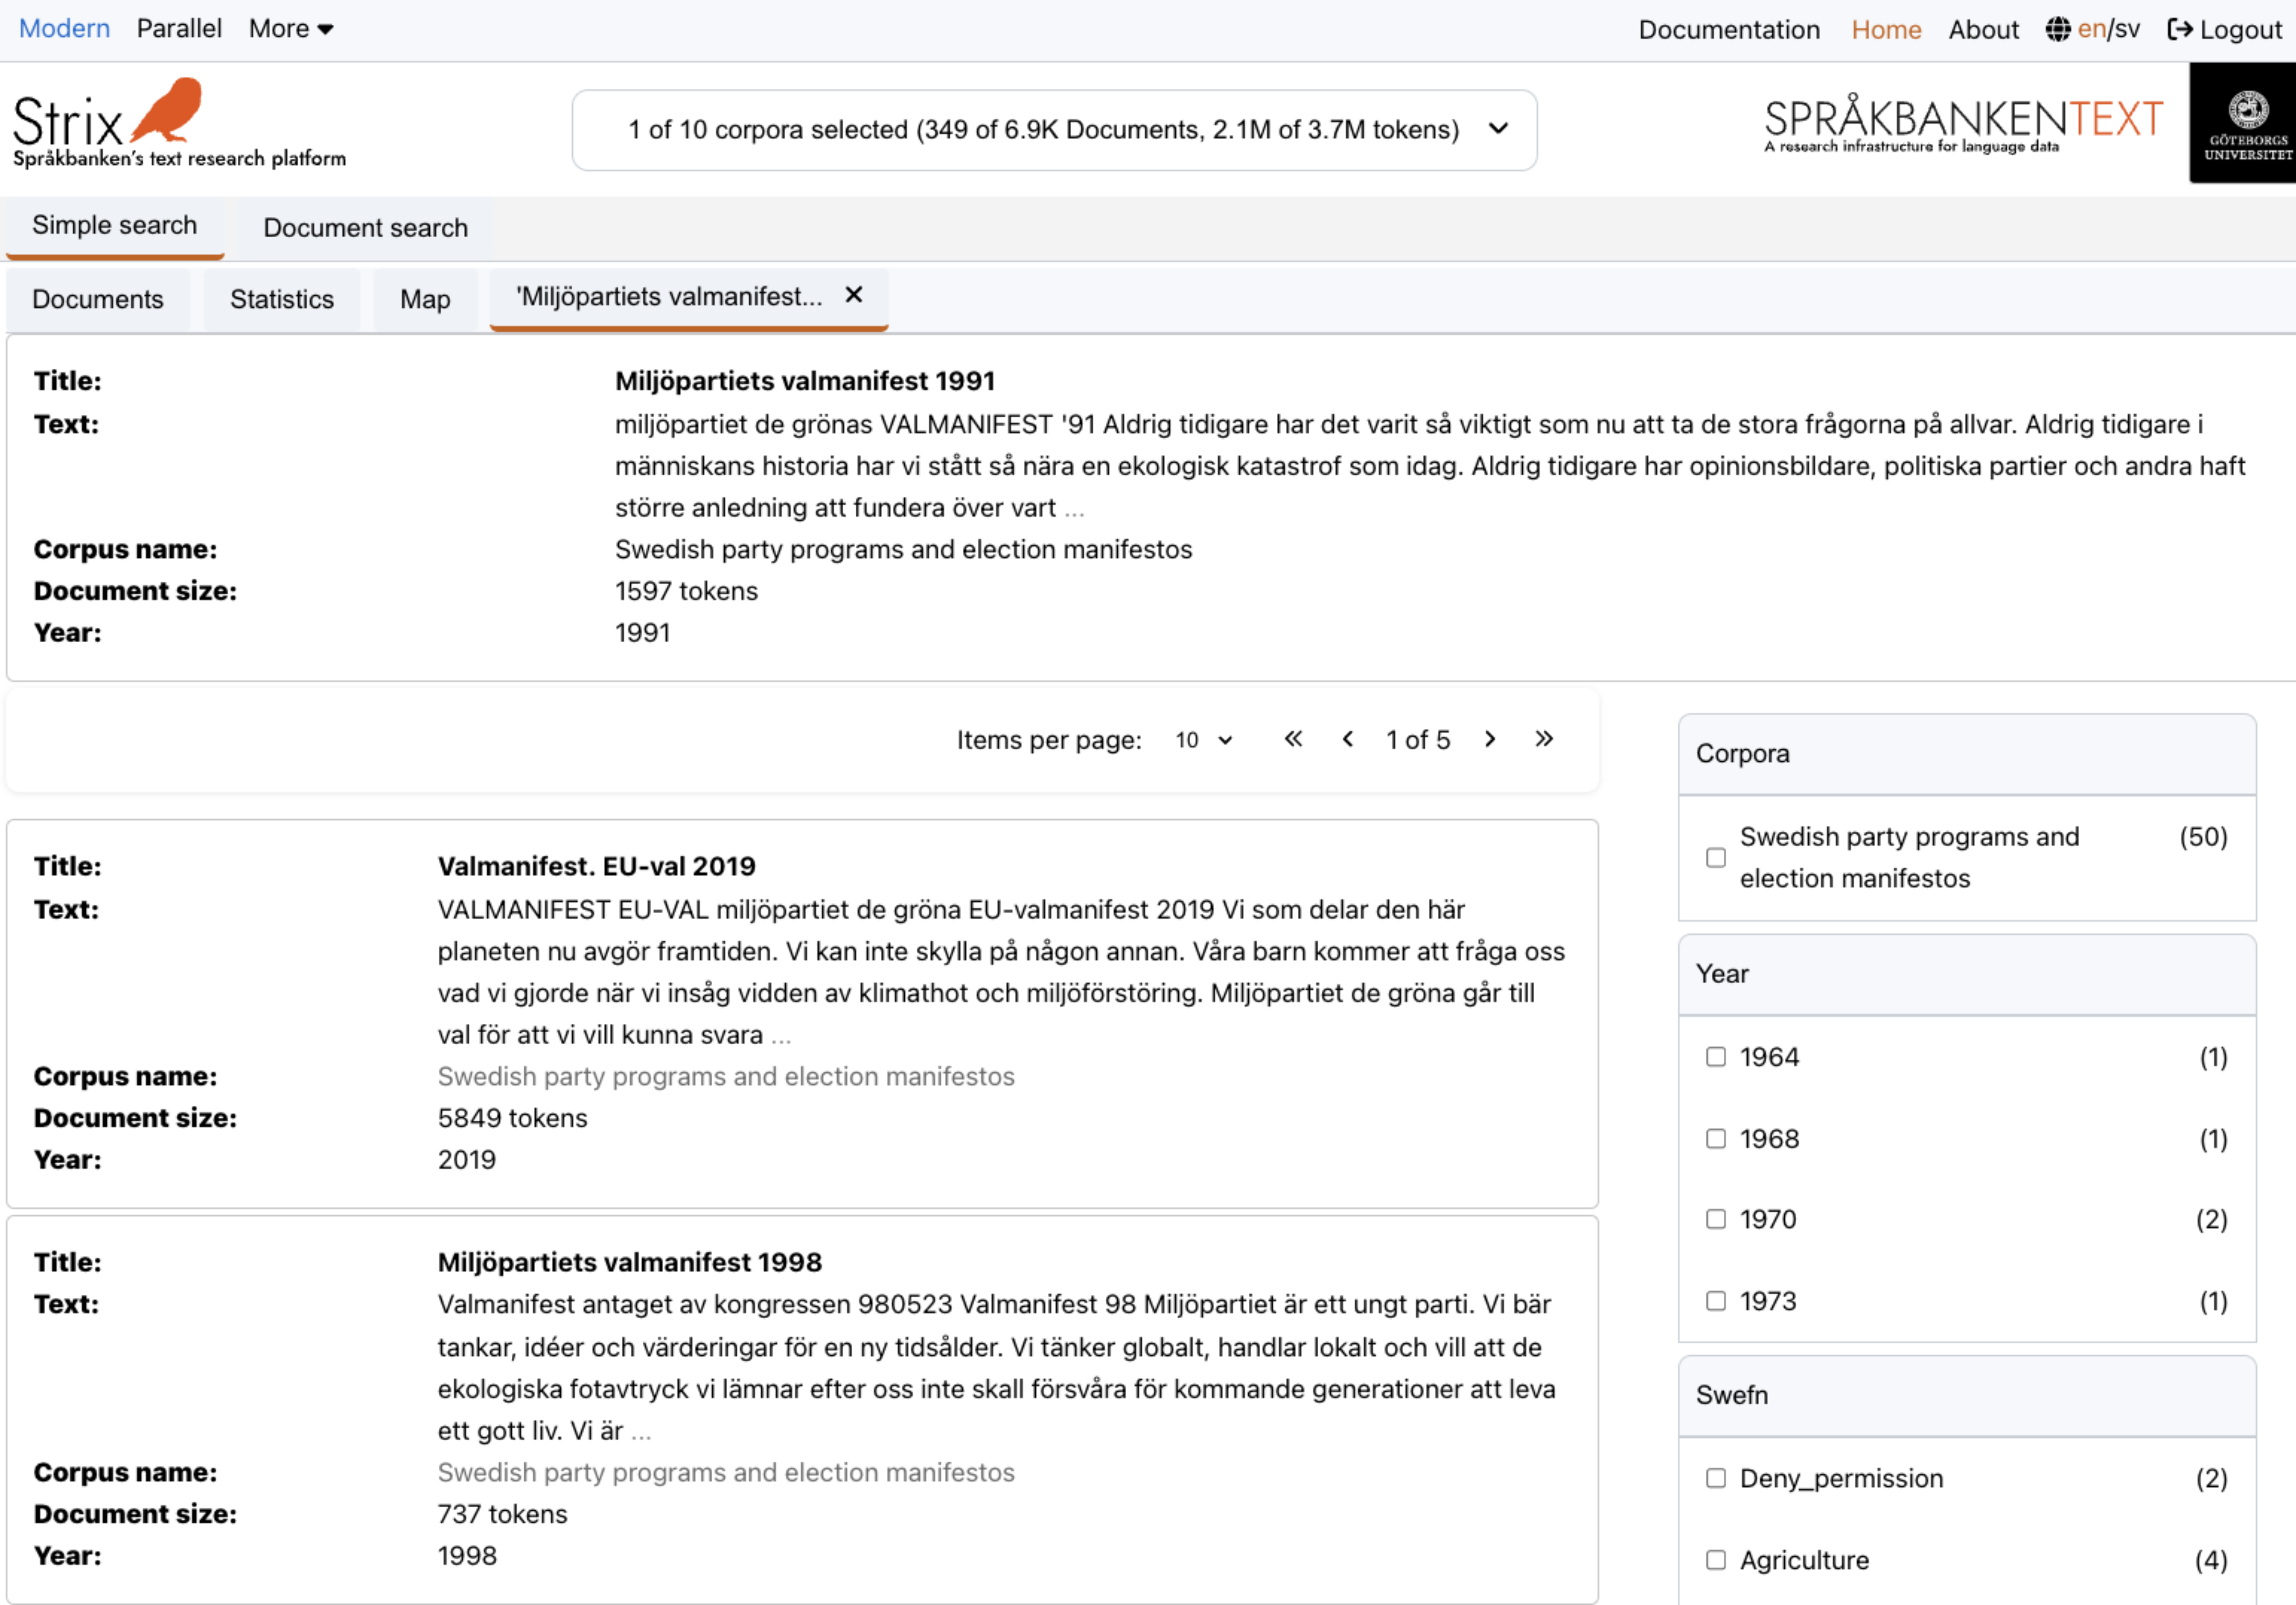
Example view
Below is an example of the Related documents interface, showing the list of semantically similar documents and the graph visualization:
How it works
Viewing related documents
- When a user selects a document, Strix retrieves the top related documents based on their semantic similarity.
- Users can explore these documents in a list view or switch to the graph view for a visual representation of relationships.
Exploring the graph view
- The graph displays related documents as nodes, with edges representing their connections to the selected document.
- Users can interact with the graph by zooming in/out or clicking on nodes to view more details.
Filtering and navigation
- Use the filtering options to refine the list of related documents based on specific metadata attributes.
- Navigate through the list using pagination controls and adjust the number of items displayed per page.
This feature is designed to provide users with an intuitive and interactive way to explore related content, making it easier to uncover meaningful relationships and gain deeper insights into the dataset.
Login access
Strix provides access to advanced text analysis tools and datasets. Some datasets in Strix are protected and require login access. Below are the details on how to gain access to Strix.
Who can access Strix?
Academic Uuers:
If you are affiliated with a university or academic institution, you can log in using your institutional credentials through the eduGAIN network. This includes most researchers, faculty, and students.Other users:
If you are not affiliated with an academic institution, you can create an account through eduID. eduID is a secure identity provider that connects to the eduGAIN network, enabling access to Strix.
Steps to gain access
For academic users:
- Visit the Strix login page.
- Select your institution from the list of eduGAIN-supported organizations.
- Log in using your institutional credentials.
For non-academic users:
- Create an account at eduID.
- Verify your identity as part of the registration process.
- Once your eduID account is active, use it to log in to Strix.
Why is login required?
Login access is required to protect sensitive datasets. By restricting access to verified users, Strix ensures the integrity of its datasets and tools while providing a secure environment for research and analysis.
Troubleshooting login issues
If you encounter any issues while logging in:
- Ensure that your institution is part of the eduGAIN network. You can check the list of supported organizations on the eduGAIN website.
- For eduID users, ensure that your account is verified and active.
- If problems persist, contact the Strix support team.
If you have further questions about login access or need assistance, feel free to reach out to the Strix support team at sb-info@svenska.gu.se.