

Within the Cassandra project we are using Korp to analyze numerous instances of language change: not one, not two, but dozens (and in the future, potentially hundreds). At this scale, it is impossible to perform searches (and process their results) manually. Fortunately, Korp has an API that makes an automatization of this process possible. We have created a set of scripts that can be easily used to generate tables and plots like the ones in Figure 1 with a few simple commands.
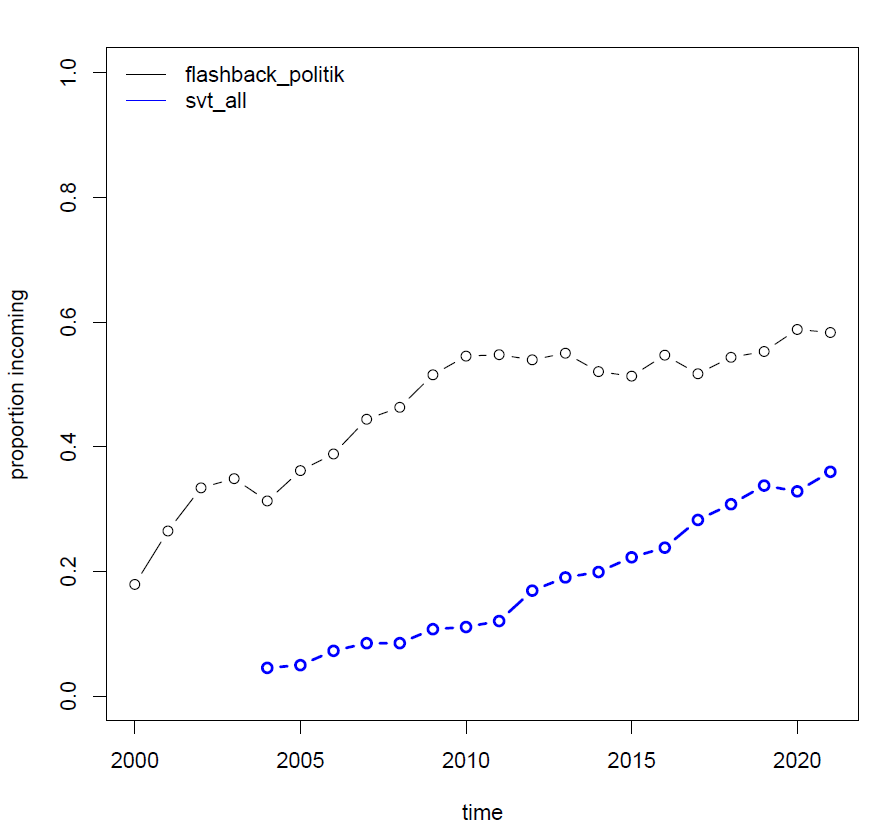
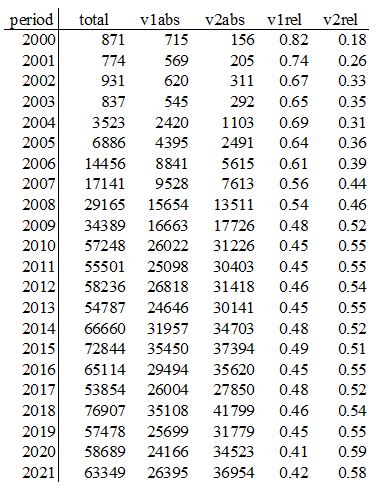
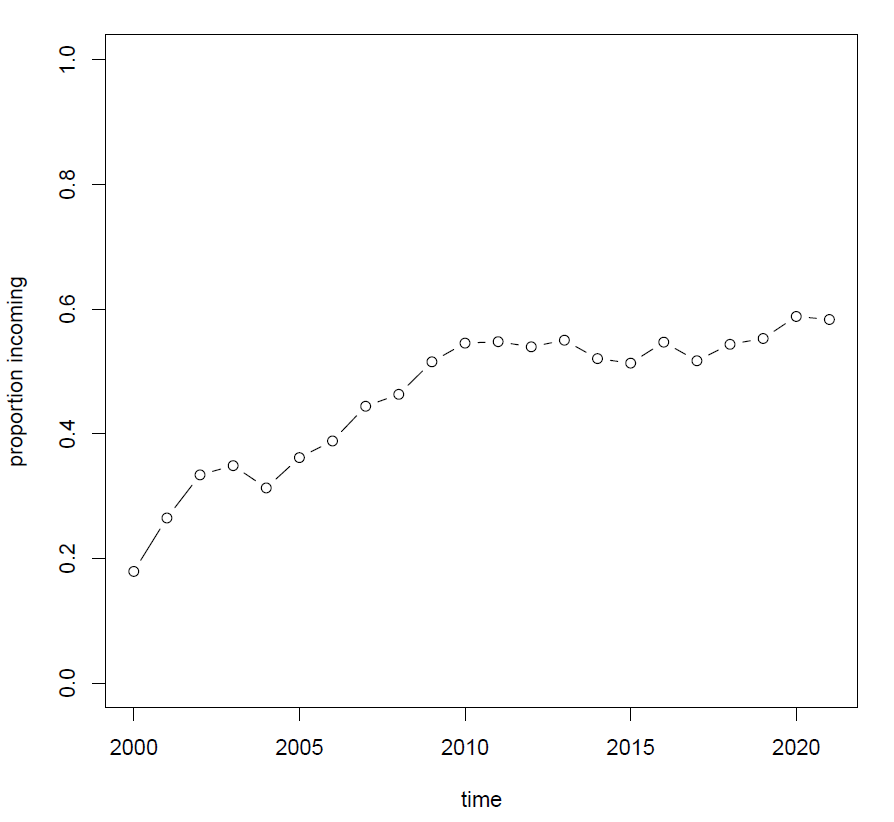
v2rel = v2abs / (v1abs + v2abs), it is this value which is plotted in Figure 1a.
(corpus: Flashback-politik)
Figure 1 visualizes the ongoing change of the Swedish future tense construction "kommer (att) VERB" where the infinitival marker att can be either preserved ("conservative" usage) or omitted ("innovative" usage). In a matter of seconds (OK, probably minutes) you can extract from Korp quite convincing evidence that there has been a noticeable increase in frequency of the innovative variant (att-omission) within the last two decades.
The Cassandra toolset (v1.0.0) allows you to define your own variables, choose any Korp corpora you like (if they are timestamped) and perform your own searches. They are somewhat similar to trend diagrams available in the Korp web interface, but have different functionality. The toolset (basically a Ruby wrapper around the count_time function in Korp API) does not have a graphical user interface and must be run from command line, but you do not need to know any programming language in order to use it. This blogpost is a very detailed tutorial on using the toolset. It assumes that you know nothing about coding and command line.
Installation
- Download all the scripts from here.
- Install Ruby. Use a version which starts with 2 (e.g. 2.7.7 or 2.6.10), the scripts may not work with 3+ versions. If the download page does not list these versions, find them here.
- Ruby uses so-called gems (libraries, packages). When you install Ruby, you should get all the necessary gems automatically, but if it does not happen and Ruby later complains that it does have gem NNN, just type
gem install NNNin the command line (if you do not know how to use the command line, see the respective section down below). - (Only if you want to make plots). Type
gem install rinrubyto install the rinruby gem. - (Only if you want to make plots). Install R.
Linguistic variables
You are almost ready to start using Cassandra. However, you must first tell her what to look for, i.e. define your linguistic variables. Let's work with the kommer att VERB example we've already seen.
Open the file korp_queries.rb in any plain-text editor (I use Notepad++) and find the following lines:
#label = kommer_att0

variant1 = [word = 'kommer' %c] [word = 'att' %c] [pos = 'VB' & msd = '.*INF*.']

variant2 = [word = 'kommer' %c] [pos = 'VB' & msd = '.*INF*.']
The first line is just the label for the variable, how we will refer to it. The next two lines define the two competing variants of the same variable. I recommend using variant1 for the conservative (older, more standard) variant and variant2 for the innovative (newer, less standard) variant.
The variants are Korp queries written in CQP. These particular lines read:
variant1 = 'a sequence of three words where the first word is kommer (case-insensitive), the second word is att (case-insensitive) and the third word is verb in the infinitive form'
variant2 = 'a sequence of two words where the first word is kommer (case-insensitive) and the second word is verb in the infinitive form'.
A convenient way to generate CQP queries is to make a query using the Extended tab in Korp, e.g.
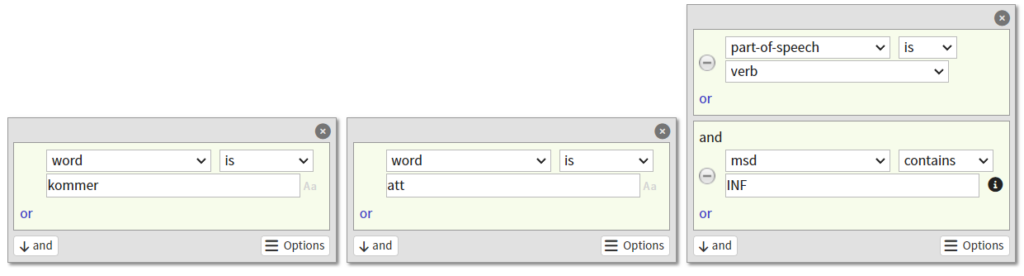
...and then switch to Advanced, where you will see:
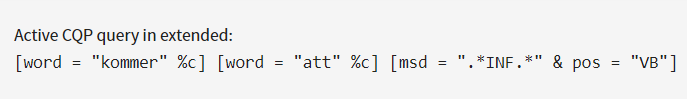
Don't forget to replace double quotes (") with single quotes (') if you copy this query to Cassandra.
Now let's see how we run the query!
Running your very first query and looking at the output
Open the command line (see section "Command line" below if you don't know how to do that), go to the directory where you've put the Cassandra scripts, and type
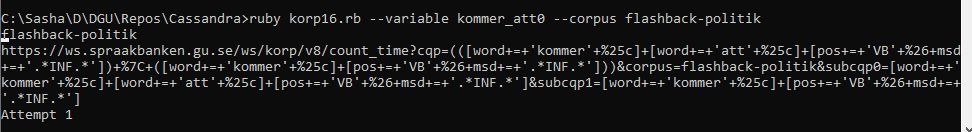
ruby korp16.rb --variable kommer_att0 --corpus flashback-politik
By writing things like --variable kommer_att0 you are passing arguments to Cassandra. In this particular case, you are telling her what to look for and where to look, but there is much more you can tell. Arguments are always passed like that --argument_name argument_value. The order of the arguments does not matter.
You will see something like that and will have to wait a little:
When Cassandra is done, you will find her output in the directory variables\\kommer_att0\\flashback\\politik\\
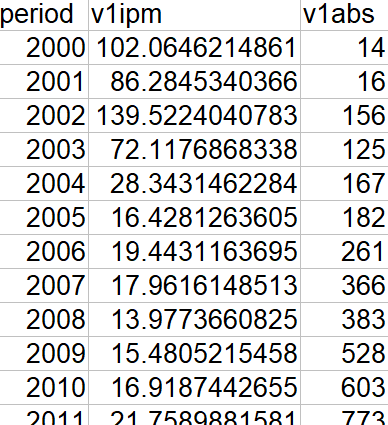
You will see two files there: all_users.json and all_users.tsv. JSON is the machine-readable output from Korp API, converted by Cassandra to TSV, readable by both machines and human beings. You already saw part of the TSV in Figure 1b. It also contains columns v1ipm and v2ipm that show relative frequencies of the variants; relative not to each other, as v1rel and v2rel, but to the total corpus size in a given period (times 106, since these are ipms, 'instances per million').
Creating a plot
Tables in the TSV format are fine for data analysis, but you may also want to visualize your data. If you have already done the previous step, it's very simple, just type in the command line:
ruby plot.rb --variable kommer_att0 --corpus flashback-politik
Remember that you must have already run korp16.rb for the same query and the same corpus, otherwise plot.rb won't be able to find the TSV that it uses to create a plot. If the TSV is there, have a look in the directory all_plots. You will see a pdf file with a long and unwieldy (but rather self-explanatory) name which will contain the following images. What it plots by default is the proportion of the innovative variant (v2rel). You have already seen this trend on Figure 1.
Congrats on the first plot!
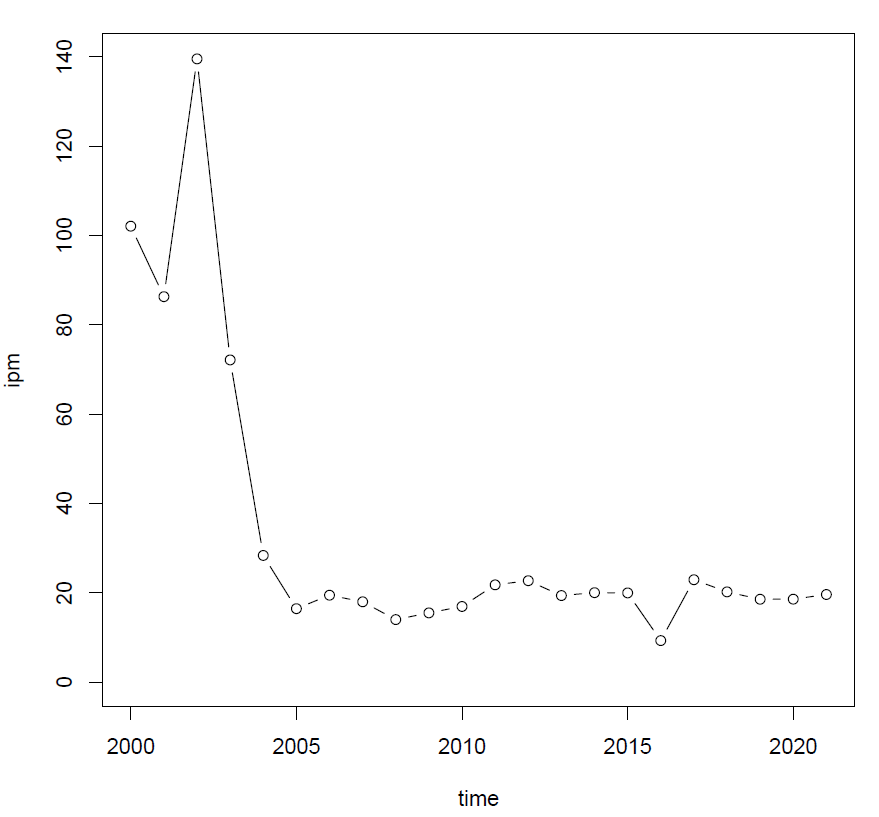
Calculating and plotting the frequency of a single variant
What if you are not interested in two competing variants, what if you simply want to look at the frequency of a single variant? That's perfectly possible. First, define your variable without any variant2.
#label = smiley1
variant1 = [word = ':-\)']
(What we are looking for is ":-)". The "\" before ")" escapes it, otherwise the query will not be correctly processed by Korp.)
Then, tell Cassandra that you only have one variant by adding an argument:
ruby korp16.rb --variable smiley1 --corpus flashback-kultur --nvariants 1
When you have two variants, as in the previous examples, you may actually tell Cassandra --nvariants 2, but you don't have to, since 2 is the default value. If an argument has a default value, it is not necessary to add it (all arguments apart from --variable and
--corpus do).
In variables\\smiley1\\flashback\\kultur you will find a JSON and a TSV. The TSV is a bit different from the two-variant table:
Obviously, there is no v2 and no rel.
You can of course make a plot in the same way, just don't forget to specify the number of variants.
ruby plot.rb --variable smiley1 --corpus flashback-kultur --nvariants 1
People just don't use decent old-school smileys anymore, do they? Or are they simply dropping the nose? Try running a two-variant search :-) vs :) and plotting the results.
Choosing corpora
The list of all SBX corpora is available here. Pick a name (case-insensitive) and feed it to Cassandra. Remember the corpus has to be timestamped. There is unfortunately no list of corpora that are, you'd have to check it yourself, either by searching in Korp's web interface or looking up corpus information in the API. For the corpus RD-BET (Riksdagens öppna data - Betänkande), for instance, use this query. Among the attributes, you will see text_date, which means 'Yay! It is timestamped'. You may also have a look at FirstDate and LastDate.
You may want to search in several corpora at once: for instance, in all Flashback subforums or in all SVT subcorpora (SVT, as many other corpora, is divided into yearly slices: SVT-2010, SVT-2011 etc.). To do that, you have to define a corpus label.
Open subforum_labels.tsv (NB: if you are using Excel, beware that it's not very good with TSVs. OpenOffice is much better, but in this particular case just use plain-text editor, that's even more convenient). The file has three tab-separated columns: label, list of subcorpora, combination rule. Let's say you want to search in Flashback-politik and Flashback-kultur. Add to the file:
first column (label): flashback-my
second column (list): -politik,-kultur
third column (combination rule): merge
What merge means is that Cassandra will take the first (pre-hyphen) part of your label (flashback) and combine with each of the items on the list to get the correct corpus names: Flashback-politik,Flashback-kultur.
If you have added this line and saved the file, you may in the future use
--corpus flashback-my
when talking to Cassandra.
Find the line with the label gp-all. GP is Göteborgs-Posten, a local newspaper, and the list for it looks like: 2001,2002,2003,2004,2005,2006,2007,2008,2009,2010,2011,2012,2013. The third column also says merge, but note that there is no hyphen before the years, since GP corpora follow an older naming convention, it's GP2001,GP2002 etc.
Have a look at the line forum-all. There is a long list of all Flashback and Familjeliv (another discussion forum) subforums. The third column says "no" (don't merge!), since there is no convenient way of combining the label and the items, corpus names have to be spelled out fully in the list.
When you feed a --corpus to Cassandra, she always checks the subforum_labels.tsv first. If she doesn't find a line with a given label, she assumes it's not a label and tries to query Korp with the given corpus name. If you want, you may add the --nolabel argument to the command line, and then Cassandra will skip checking the subforum_labels.tsv. It should not really affect the results.
Plotting data from several corpora
Sometimes you do not want to combine several corpora into a single supercorpus, but you do want to compare results for them (as we did for Flashback-politik and SVT-all on Figure 1a).
The command for that is
ruby plot.rb --variable kommer_att0 --corpus flashback-politik
--more_corpora svt_all
You may add up to seven extra corpora (you may also add more, but you will run out of colours for colour coding). List them all after --more_corpora, separated by commas (no spaces!).
Try, for instance, the following command (remember that you have to run korp16.rb for every single corpus first!).
ruby plot.rb --variable smiley1 --corpus flashback-dator --nvariants 1
--more_corpora flashback-kultur,flashback-resor,flashback-samhalle
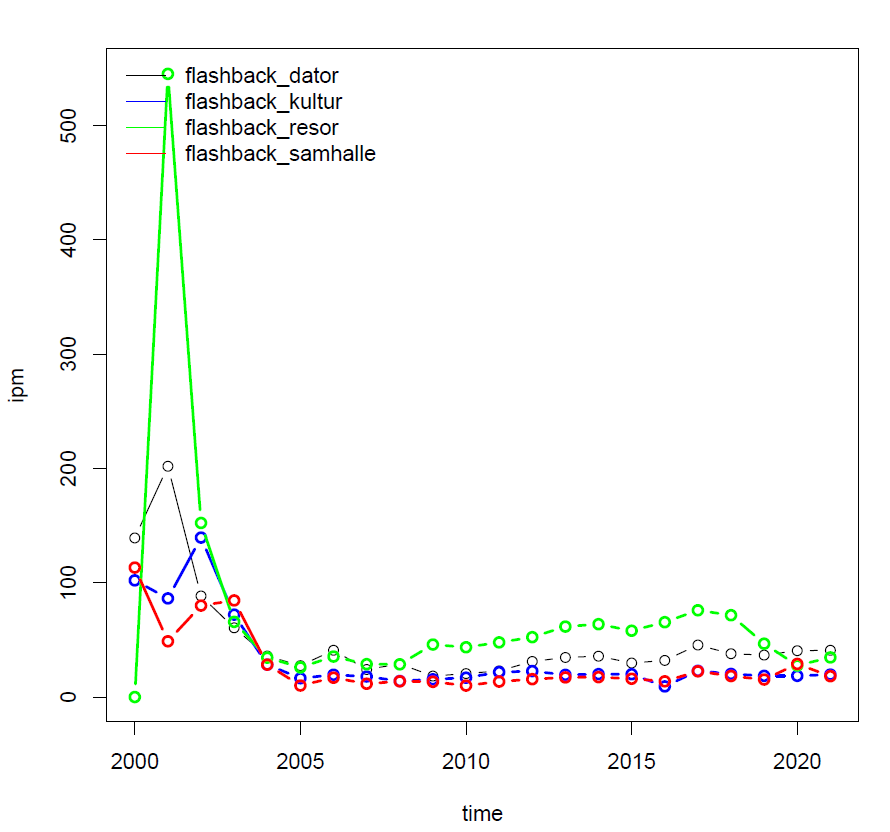
To be honest, colour coding is less than perfect (and it is generally a bad idea to use only colour without additional coding through e.g. line type), and so is the placing of the legend. But it will do for now.
Several variables on one plot
You can also plot several variables on the same plot. Let's look at an example. Remember we had smiley1 variable (smiling smiley with a nose). Let's find the lines which define the same smiley without a nose...
#label = smiley2

variant1 = [word = ':\)']
...make a couple of searches...
ruby korp16.rb --variable smiley1 --corpus flashback-resor --nvariants 1

ruby korp16.rb --variable smiley2 --corpus flashback-resor --nvariants 1
...and place the output on the same plot:
ruby plot.rb --variable smiley1 --corpus flashback-resor --nvariants 1
--more_variables smiley2
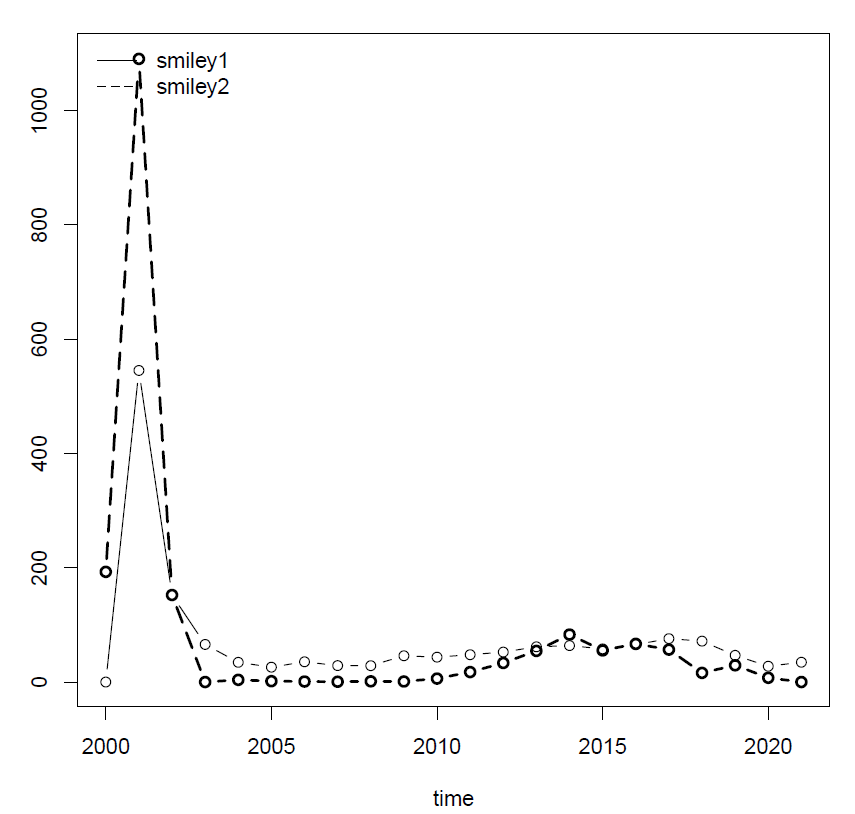
You can add more than one extra variable (list them comma-separated, no spaces). Cassandra supports up to five different line types, but the plots usually start losing readability already with three variables.
You can't currently both combine several variables and combine several corpora on the same plot. It's not actually clear whether that would be useful: again, the plots would probably be difficult to read.
Going back to our previous research question about the smileys, it seems that the noseless old-school smiley is also on decline, it's not the case that the one with the nose is dying out because it is being replaced by the noseless equivalent. We can define a two-variant variable and create a different visualization of the same data.
#label = smiley1vs2

variant1 = [word = ':-\)']

variant2 = [word = ':\)']
ruby korp16.rb --variable smiley1vs2 --corpus flashback-resor

ruby plot.rb --variable smiley1vs2 --corpus flashback-resor
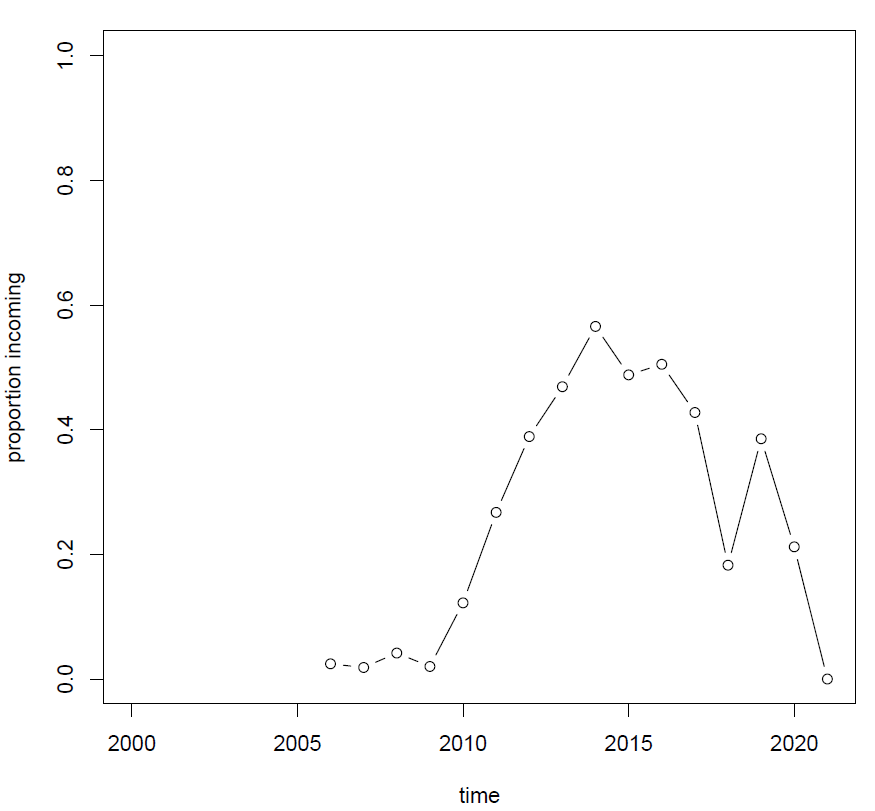
That's interesting: seems that at first, the noseless variant is infrequent, then it gradually starts replacing the longer variant, but then succumbs to it again. Let's see what happens with the equivalent sad smiley (variable defined as below) and put the results on the same plot. The sad smiley is less frequent, so we need a larger corpus and will use Flashback-all (defined in subforum_labels.tsv).
#label = smiley1vs2neg

variant1 = [word = ':-\(']

variant2 = [word = ':\(']
ruby korp16.rb --variable smiley1vs2 --corpus flashback-all

ruby korp16.rb --variable smiley1vs2neg --corpus flashback-all

ruby plot.rb --variable smiley1vs2 --corpus flashback-all
--more_variables smiley1vs2neg
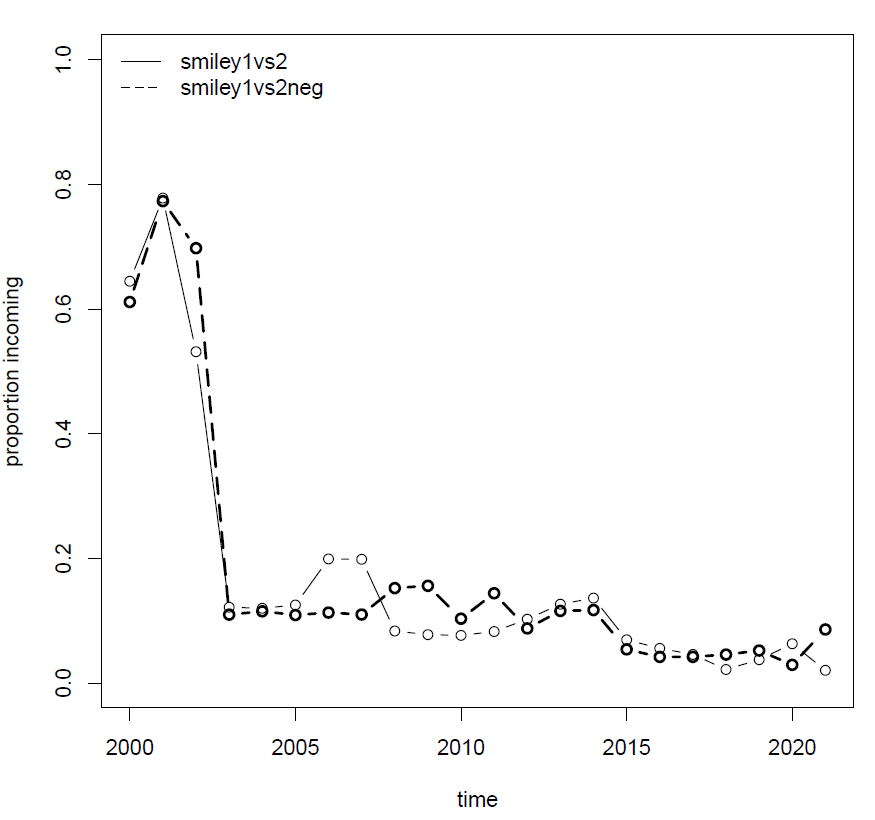
I'll leave it to you to interpret the results.
Korp and plot!
You don't necessarily have to run a query via korp16.rb first and then give another command to make a plot. Instead, you can run
ruby korp_and_plot.rb --corpus corpus_name --variable var_label [all other arguments]
This wrapper will run both korp16.rb and plot.rb for you with the given arguments.
That's it, now you are familiar with Cassandra and may ask her to make you as many plots and tables as you want! The next section lists all the arguments that you already know and some more. After that, we'll look at some additional functions.
Full list of arguments
--corpus Obligatory argument. A corpus where the search is to be performed. Can be a name of a Språkbanken corpus or a label specified in subforum_labels.tsv
--variable Obligatory argument. A linguistic variable to search for. Has to be defined in korp_queries.rb or another file (see --variable_source).
--nvariants 1 or 2 (default), see above.
--granularity y (year; default) or m (month). Monthly plots might look somewhat crammed.
--user default: all_users. Search only in the posts written by a specific user. Works only for (some) social media corpora.
--variable_source default: korp_queries.rb. A file where the variables are defined
--var_output where to output the variables and all_plots directories and all their contents. Default: same directory as the scripts
Relevant only for plotting:
--whattoplot default: v2rel for two-variant variables, v1ipm for one-variant variables. Other options are v1rel for two-variant variables and v1abs for one-variant variables. With other columns it won't really work well.
--threshold default: 20. For two-variant variables, do not plot those observations for which the total frequency of a variable (sum of the absolute frequencies of both variants) is smaller than the threshold. The idea is that v2rel is unreliable if there are too few occurrences and it's best not to show it
--max The range of the Y-axis will be (0, max). Default: 1 for two-variant variables, maximum observed value for one-variant variables
--format Image output format. Default: pdf (yields highest quality). Other options: jpeg, bmp, png, tiff.
--dir Where to output the images. Default: all_plots.
Relevant only for querying:
--nolabel No need to provide any value. This argument says that the corpus name is not a label and does not have to be searched for in subforum_labels.tsv
--local No need to provide any value. If it happens that you already have a correct JSON, but not a correct TSV, use this argument, and Cassandra will not try to update JSON by querying Korp API again (which may take a lot of time for complex searches). She will only try to recreate the TSV.
Relevant only for concordance (example extraction, see below):
--limit limit + 1 = The maximum number of examples you want to extract from each corpus. Default: 109 (meant as "all").
--context see here. Default = "1 sentence"
--show see here. Default: msd,lemma,pos,ref,lex,deprel,dephead.
--sort see here. Default: none
--structs see here. Default: none.
Troubleshooting and tweaking
It may happen that you get an error when running the scripts.
If the error message starts with "Cassandra says", this is an error I have thought about, you will hopefully get to know what is wrong (most likely you passed wrong arguments).
If not, that's either Ruby or R error message. Don't despair and try to understand what's wrong. Ruby messages are usually very informative and rather easy understand, R messages are usually unfortunately much less readable.
If you are familiar with coding, you may easily improve and tweak the scripts to make them more useful for your purposes.
Will there be more functionality?
Hopefully. One intention is to make it possible to include social factors (age, network structure) in the analysis, another to detect certain change trends automatically.
There is actually some additional functionality already now, but it's not working perfectly and thus not documented here, with one exception (see next section).
Aggregate results from several corpora
You already know how to search in a supercorpus (=a collection of two or more corpora). It may, however, happen, that you have already searched in corpus A and corpus B and do not really need to run another search (takes time and energy), just aggregate the results. Or maybe you haven't searched yet, but your supercorpus is so big that Cassandra can't get an answer from Korp API (that can happen sometimes). In this case, it makes sense to split the supercorpus into smaller corpora and then, again, aggregate the results.
For that, you use a separate tool in the following way:
ruby merge_results.rb --variable smiley1 --corpus flashback-dator,flashback-kultur,flashback-resor,flashback-samhalle --nvariants 1
--merged_label flashback-tutorial
You list all the corpora after --corpus (comma-separated, no spaces). You have to provide a --merged_label, it is recommended that it follows the corpus-subcorpus naming convention. If there is no hyphen, Cassandra will treat the (missing) subcorpus name as "all".
Caveats:
-- for aggregated results, there is no JSON, only TSV
-- there are no relative frequencies (ipm), only absolute frequencies and, for two-variant variables, also proportions
-- some values may differ a little from those you would have seen after doing a usual search, probably due to rounding errors.
Concordance (example extraction)
Sometimes you want not only to count something, but also to look at the actual examples. For that, Cassandra has another script: api_extract_universal.rb (which a wrapper not for count_time, but for query. It uses the same arguments as korp16.rb and some additional ones (see above). It outputs a JSON file per every corpus you process. You'd need an additional script to convert those JSONs into a simple TSV (currently, there is no universal solution for that, since it would depend very much onto what kind of TSV you need).
Command line
To open the command line (aka command prompt, terminal, shell), do the following:
-- Windows: Press Win + R to open the Run box, then type "cmd" and hit Enter to open it
-- Mac: Click the Launchpad icon in the Dock, type Terminal in the search field, then click Terminal.
If you are using Linux, you probably know what to do.
Another trick is to open the command line from your plain-text editor. In Notepad++, use File>Open containing folder>cmd.
Here's how my command line (Windows) looks:
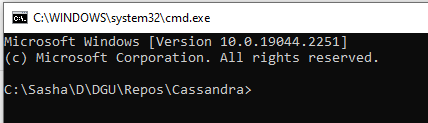
I can type in a command and the system will try to run it. I can, for instance, check whether I have Ruby installed and if yes, which version. For that, I type ruby --version.
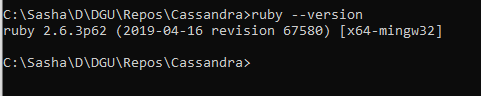
The system responds (see the upper lines) and is ready to accept further commands.
A good thing to know is that if you press the "Up" arrow, the interface will show the last command you typed, this is very convenient.
The only command you'll probably need is cd (change directory).
cd my_folder will get you to my_folder
cd.. (Windows) or cd .. (Mac) will get you one level up, to the parent directory.