

Problem framing and experimental setup
This blog post explores the prevalent themes across multiple threads on the popular Swedish discussion forum Flashback, discussing COVID-19 vaccine and vaccination, using the topic modeling library BERTopic. Among its diverse array of topics, the Flashback forum actively engages users in addressing and debating questions in all kinds of issues; from crime, politics, cooking, gaming, parenting including COVID-19 vaccines and vaccination. The point of departure for this blog are posts from 14 relevant thread discussions posted during 2021. We apply BERTopic, a modular topic modeling framework, which utilizes pre-trained language models and applies clustering techniques to identify prevailing topics. This enables a nuanced exploration of overarching themes, offering insights into the multifaceted nature of these discussions in the forum, using a state-of-the-art pre-trained language model for Swedish. Moreover, the blog post takes a technical, rather a theoretic, perspective on this exploration, introducing some basics of mining and analyzing text using BERTopic in Python, implemented in a Google Colab notebook - this exploration is not exhaustive, but a starting point for further research.
The dataset
The experiments are carried out on a dataset with posts from 14 hand-selected Flashback threads that discussed COVID-19 vaccines and vaccination throughout 2021; the time where phase I of the monovalent booster dose availability started. The aim was to identify and extract dominant themes expressing pros or cons about the discussions in these threads. Two versions of the thread posts (downloaded and structured before processing) can be used, one with almost 16,000 unique posts (ca 13,500 without questions) and a smaller random subset of 2,000 posts (provided for rapid experimentation with the functionality of BERTopic).
- Facebook censurerar vaccin kritiker
- 57 Vetenskapsmän släpper shockerande studie om Covid-19 Vaccinen!
- Spikproteinet orsakar de svåra symptomen för covid-19 och vaccinerna
- Jag ljuger om att jag har tagit Corona-vaccinet
- Varför så många som avstår från att ta vaccin?
- Ville inte ta covidvaccin - nu ligger paret i respirator
- Till er som inte vill vaccinera er
- Pfizer producerar Covid-piller, ska tas två gånger per dag
- Studie visar faror med covid-19-infektion och möjligtvis mRNA-vaccinen
- Varför blir folk så provocerade av att man vägrar vaccinet?
- Vad ska man göra om man vägrar ta corona-vaccin?
- Vaccinerna - biverkningstråden.
- Ska du vaccinera dig mot corona-viruset?
- Vaccinerade, när kan ni tänka er ta en tredje dos?
Flashback is Sweden’s largest open forum on the internet (almost 1.6 million registered users; 82 million published posts) and one of the largest open web forums globally. The Flashback texts are usually short, 1–20 lines, but after putting them together, they form somewhat coherent narratives. Independent from global media ownership, Flashback promotes openness, freedom of speech, and liberates discussions from censorship. A plot of the length of the posts in the dataset, is shown in Figure 1 below.
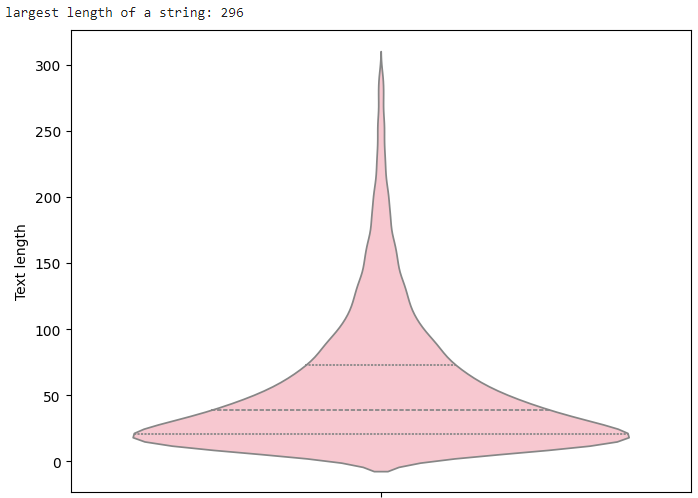
Figure 1. The length of the posts' input.
Dynamic topic modelling using BERTopic
The BERTopic framework (v. 0.16) relies on context, by definition, it doesn’t require substantial data preprocessing. Moreover, BERTopic generalizes better than more “traditional” topic modelling techniques, such as Latent Dirichlet Allocation, creating more clear-cut topics, judging by topic coherence and topic diversity scores. Nevertheless, some preprocessing, such as removal of Swedish (and English) stop words and HTML-tags, is performed to eliminate noise. BERTopic has a modular architecture made up of several layers that can be stacked. By default, BERTopic uses sentence transformers, which are optimized for semantic similarity, enhancing the clustering process; it leverages BERT embeddings and class-based Term Frequency Inverse Document Frequency (c-TF-IDF) to create dense clusters allowing for easily interpretable topics whilst keeping important words in the topic descriptions. BERTopic does not require as input the number of clusters. Although there is a risk that resulting clusters can jeopardize the semantic interpretation, there are techniques to mitigate this by e.g. reducing the outliers or merge generated topics after training. For the experiments we use the Swedish Sentence Transformer model (“sentence-bert-swedish-cased") trained by the National Library of Sweden, KBLab, which is available on the Huggingface repository. The model can be fitted on all or a smaller subset of the posts.
Interactive notebooks and the dataset structure
Interactive notebook-based environments, such as JupyterLab (Jupyter), Google Codelab (Colab) or the Kaggle Notebooks are powerful (web-based) interactive development resources for conducting exploratory (textual) data analysis (EDA). The purpose of EDA is to find valuable insights in the data. Notebooks facilitate in-depth EDA by allowing collaborative research while promoting transparency and reproducibility by easily creating and sharing computational documents such as code, and data. These environments allow the embedding of code (code snippets in ‛code cells’) which can be easily executed with the results immediately presented into the user’s window. Formatted text or ‛ markdown cells’ is used to supplement and explain the code. Moreover, code cells can be independently executed in an arbitrary order, edited between runs and iterations, share variables and functions, and allow the experimentation with different methods, models, and tools. The implementation and results for the exploration in this blog are implemented in a Google Colab notebook that can be downloaded from this link: Flashback Exploration using BERTopic.ipynb.
The dataset(s) and stopwords are accessible in the cloud-based repository github, in Colab the user can prefix an exclamation mark ‘!’ before any commands in a code cell to indicate use of the terminal. The command line tool cURL downloads the Flashback dataset. The structure of the Flashback posts are provided in a comma-separated-value format (‘.csv’). A snapshot of the Flashback .csv file is shown in Figure-2a. Figure 2b shows the top-10 most frequent authors of posts and the 10 most frequent days with most posts in the dataset. The file extended_stopwords.txt contains a list of stop words (this file can be downloaded from this link: sv_stopwords_extended.txt). These are words such as Swedish (and English) conjunctions, prepositions, pronouns, certain adverbs, which are typically non-informative, as well as some very frequent words in the posts, such as 'vaccine', which we would like to filter out. BERTopic stop word removal is performed as an optional post-processing step, after the model has been fitted. The choice of stop words -- in other words -- does not affect the topics detected when using BERTopic.
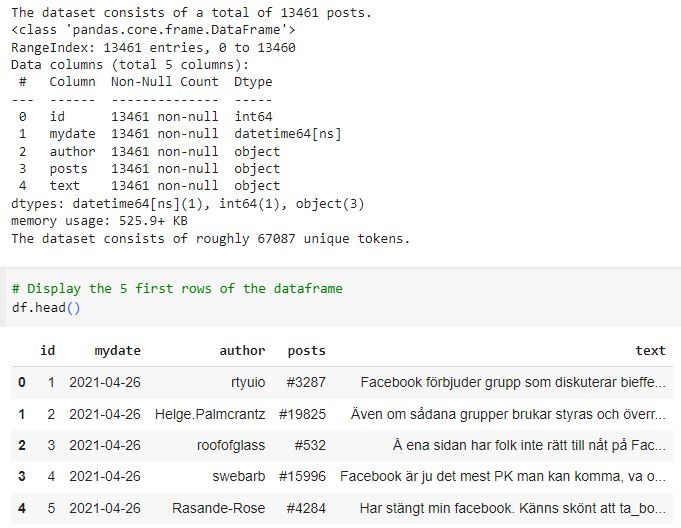
Figure 2a: Import of the Flashback dataset.
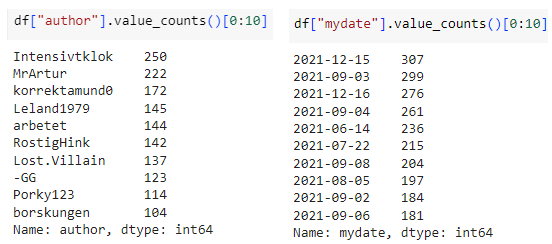
Figure 2b (left): The top-10 authors with more posts in the dataset; Figure 2b (right): The top-10 most frequent days with most posts in the dataset.
Parameter settings
As the BERTopic framework relies on context, by definition, it doesn’t require substantial data preprocessing. According to several studies, BERTopic generalizes better than more “traditional” topic modelling techniques, such as Latent Dirichlet Allocation (LDA), creating more clear-cut topics, judging by topic coherence and topic diversity scores, as well as advantages in terms of its high modularity, which allows for extensive personalization at each stage of the topic modeling process. Nevertheless, some pre-processing, was made on the dataset, by the removal of (Swedish) extended stop words and HTML-tags, in order to eliminate noise. To further fine-tune the model, and raise the quality of the topic names and keywords we experimented with various hyperparameter settings: i. maximal marginal relevance (set to 0.5): which increases or decreases the diversity between the words in the topic representation (ranging between 0 [no diversity] to 1 [max diversity]); ii. dimensionality reduction using UMAP (set to cosine) which computes the distances and dimensionality of the embeddings; iii. bigrams can be allowed using the ngram_range parameter set to length 2; iv. the max_features of the vectorizer was set to 7500 - which consider the top tokens ordered by term frequency across the dataset, and v. the number of topics was set to auto. Although BERTopic works quite well out of the box, there are a number of hyperparameters to tune according to your use case. Both parameters directly accessible in BERTopic but also hyperparameter optimization in sub-models such as HDBSCAN and UMAP (Fig. 3).
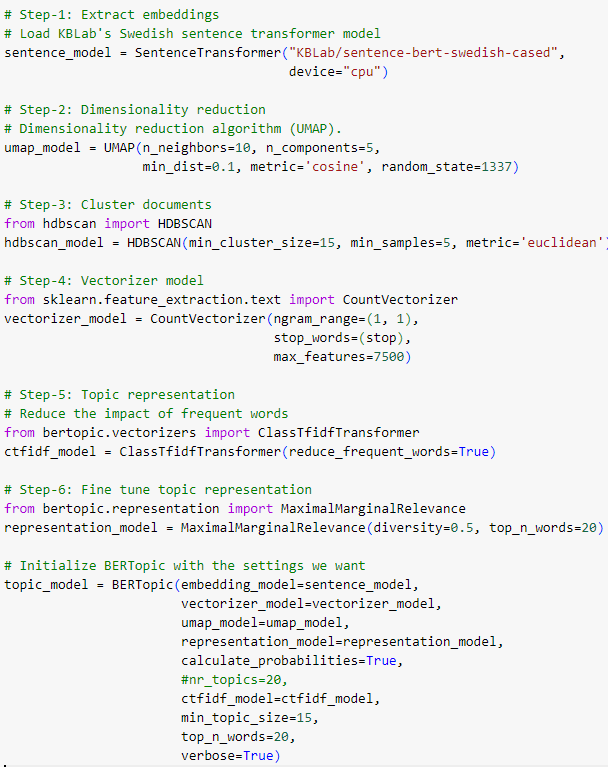
Figure 3. Various BERTopic parameters before fitting.
Content explorations - first overview of the topics
Figure 4 shows the topics BERTopic found, shown below using the topic_model.get_topic_info(). Here, the column Topic enumerates the different topics. Count shows how many topics were assigned to a given topic. Name displays the most representative words for documents contained within the topic. Topic -1 indicates those documents that could not be assigned in to a topic. We can increase the number of documents assigned to topics by changing parameters before fitting, or by lowering the inclusion threshold, but this may come at the cost of making the topics "noisier" (less specific to a given subject). Thus, with the above setting there were 36 generated topics assigned to the 13,460 posts. This means 6,950 posts were considered as outlier topics (Topic -1).
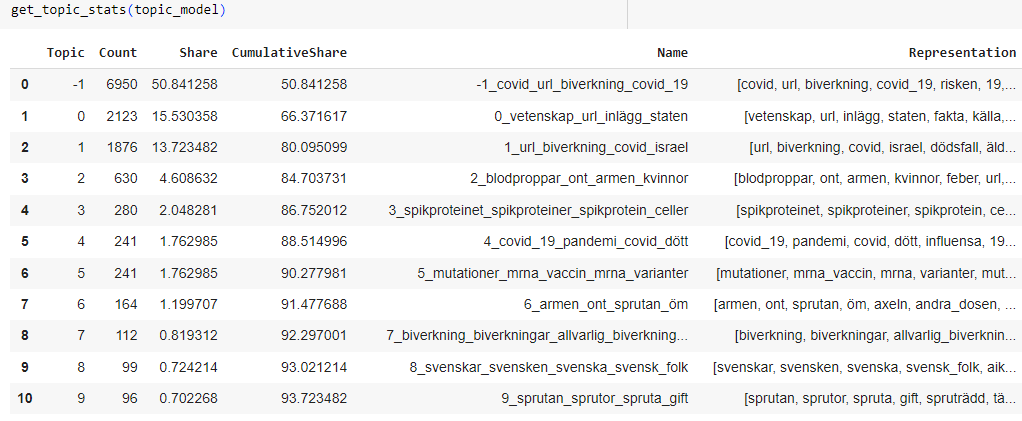
Figure 4. First overview of the generated topics.
Various content visualizations
The ranks of all terms across all topics
Each topic is represented by a set of words, starting with the best representative one. Each word is represented by a c-TF-IDF score. The higher the score, the more representative a word to the topic is. Since the topic words are sorted by their c-TF-IDF score, the scores slowly decline with each word that is added. These words, however, do not all equally represent the topic. This visualization shows how many words are needed to represent a topic and at which point the beneficial effect of adding words starts to decline. The Term score decline diagram gives us insight in how the scores of terms decrease to a level where their influence is hardly distinguishable from that of other terms.
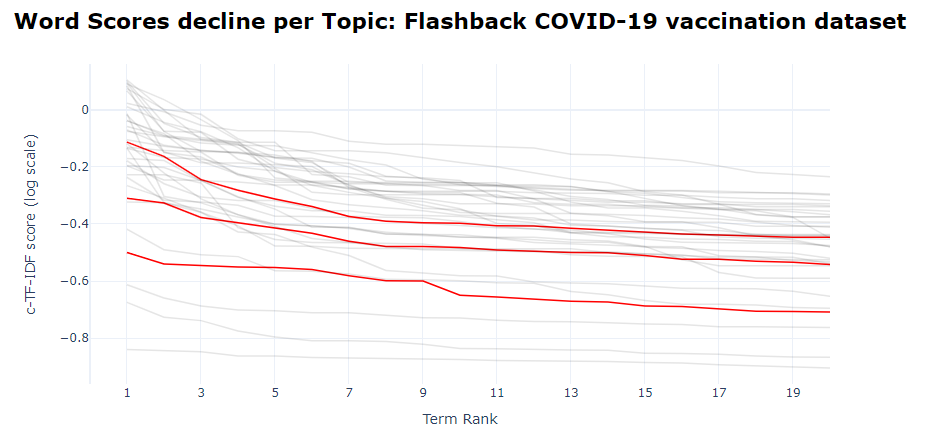
Figure 5. The ranks of all terms across all topics (with topics 2,7,15 highlighted).
Frequency of topics over time
Figures 6a and 6b shows the evolution of topics over time, which uncovering changes in the events over the studied period; e.g. Topic 2 "blodproppar, ont, armen..." seems to rapidly increase during the last quarter of 2021.
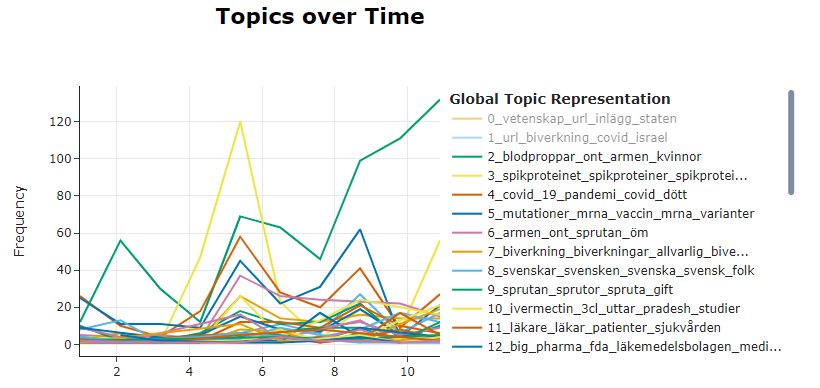
Figure 6a. Visualization of all the topics over time.
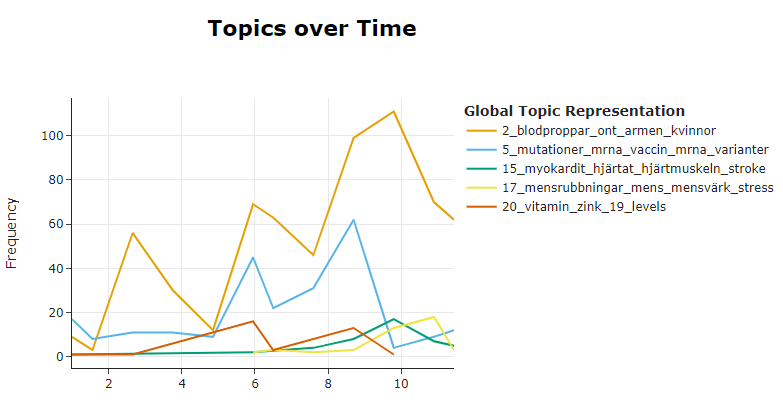
Figure 6b. Visualization of selected / interesting topics over time (here: 2,5,15,17,20).
Barchart of selected topics
We can visualize the selected terms for a few topics by creating bar charts out of the c-TF-IDF scores for each topic representation (Fig. 7). Insights can be gained from the relative c-TF-IDF scores between and within topics. The ngram_range-parameter allows us to decide how many tokens each entity is in a topic representation. For example, we have words like game and team with a length of 1 in a topic but it would also make sense to have words like hockey league with a length of 2. To allow for these words to be generated, we can set the `ngram_range` parameter in the `vectorizer_model` to "(1, 2)".
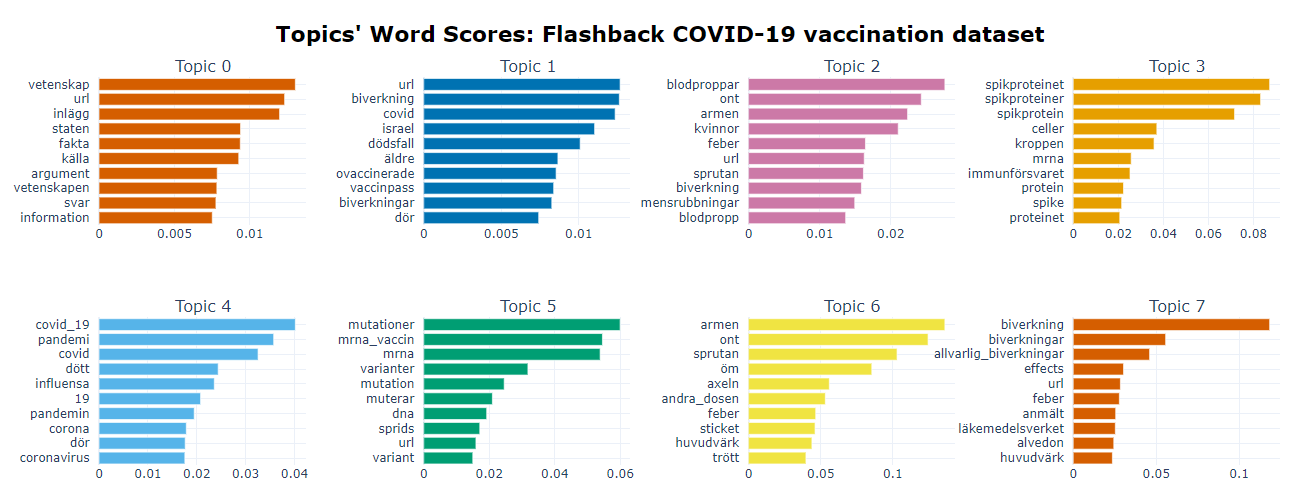
Figure 7. Topic word scores.
Intertopic Distance Map
Topics that are seemingly more related to each other are found closer together in a 2D representation of the topics (Fig. 8). We can model this relationship by considering the “distance” between them. The farther the distance between two topics, the more unrelated they are. On the contrary, the shorter the distance, the closer in relation two topics are.
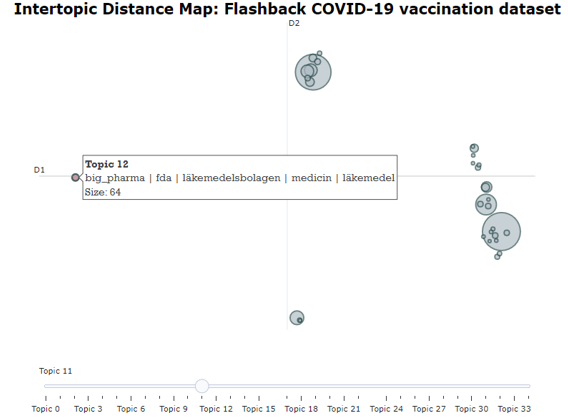
Figure 8. Topic word scores.
Hierarchical topic clustering
These hierarchical representation makes the effect of merging certain topics more understandable. Some topics might be logical to merge whilst others might not. Moreover, we can now see which sub-topics can be found within certain larger themes.
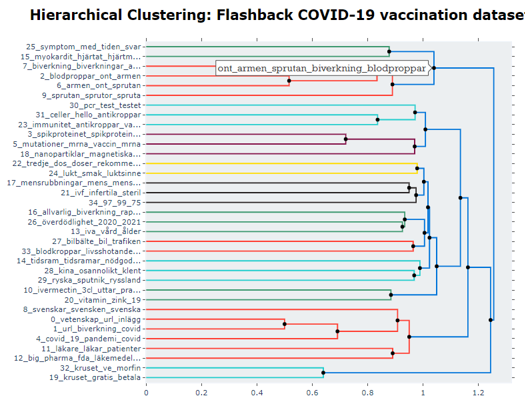
Figure 9. The potential hierarchical nature of topics.
Heatmap and similarity matrix
Figure 10 shows a heatmap of the topic's similarity matrix. Based on the cosine similarity matrix between topic embeddings, a heatmap is created showing the similarity between topics.
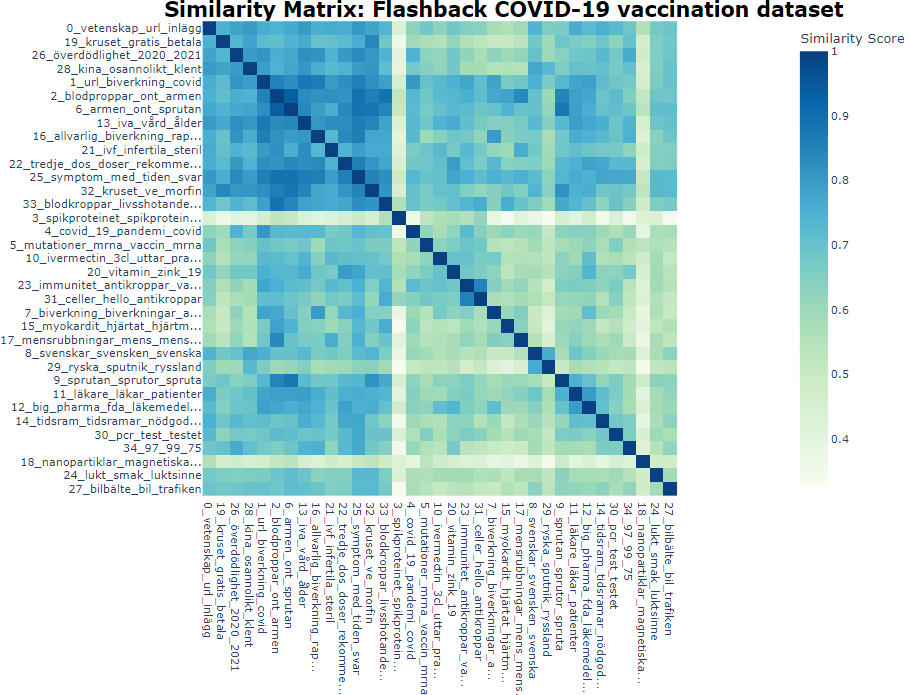
Figure 10. The potential hierarchical nature of topics.
Topics per class
Topics can be extracted, grouped and visualized according to categories/classes. For example, if you have specific groups of authors that might be active in many threads, or approach topics differently, then extracting them would help understanding how these users talk about certain topics. In other words, this simply creating a topic representation for certain classes that you might be in your data. This can be done using the `.topic_per_class` method, supplying the original documents along with corresponding classes the documents belong to. In Figure 11 we chose to see which post authors are common in the chosen topics 7 and 15.
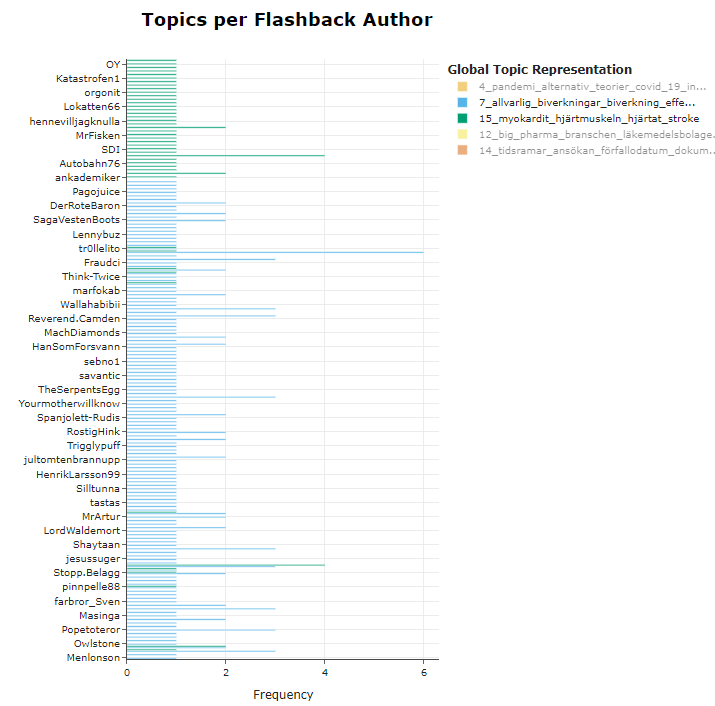
Figure 11. Topics per class (here authors).
Acknowledgments and relevant links
The blog is part of the project Rumour Mining (MXM19-1161:1) financed by the Bank of Sweden Tercentenary Foundation (Riksbankens Jubileumsfond); with support from Huminfra, a Swedish national infrastructure for the Humanities, funded by the Swedish Research Council (2021-00176). The inspiration for this blog comes from a workshop organized in December 2023 by KBLab a data lab at the National Library of Sweden. The following members from KBLab participated in creating and presenting different segments of the workshop: Faton Rekathati (Notebook, code, visualizations); Chris Haffenden (Interpretation of results, feedback on notebook); Love Börjeson (Introduction to topic modeling).
Adaptations (Jan-Feb 2024) by: Dimitrios Kokkinakis (new data; stopwords; new explorations and visualizations).